
1st in Points – Ross Chastain
| Category | Statistic | 2023 Rank | ªRank Thru 2 Races |
| Avg. Fin.¹ | 6.0 | T2nd of 41 | T46th of 915 |
| Completed Laps%¹ | 100% | T1st of 41 | T1st of 915 |
| Laps in Top15%¹ | 58.5% | 11th of 41 | 235th of 868‡ |
| Avg. Driver Rating¹ | 100.65 | 2nd of 41 | 85th of 868‡ |
| Wins | 0 | T3rd of 41 | T40th of 915 |
| Poles | 0 | T2nd of 41 | T37th of 915 |
| Top 2’s | 0 | T5th of 41 | T76th of 915 |
| Top 3’s | 1 | T1st of 41 | T11th of 915 |
| Top 5’s | 1 | T1st of 41 | T25th of 915 |
| Top 10’s | 2 | T1st of 41 | T1st of 915 |
| DNF’s¹ | 0 | T1st of 41 | T1st of 915 |
| Stage Wins | 3 | 1st of 41 | T1st of 301* |
| Stage T10s | 3 | T1st of 41 | T15th of 301* |
| Stage Pts | 30 | 1st of 41 | 4th of 301* |
| Playoff Pts² | 3 | T3rd of 41 | T15th of 301* |
ªSince Playoffs started in 2004
¹Ranks of drivers to start 40% of races thru 2 races
²Earned from races only
*Stage racing started in 2017
‡Loop Data started in 2005, max Driver Rating is 150.0
- Notable Streaks this/last year
- 6 straight Top 10 finishes (active streak)
- 2022 Intermediate Track Stats (Avg. Fin. and Driver Rating rank among drivers with 1+ Intermediate Track start, 45 drivers)
- 10 Races, Avg. Finish 10.4(4th), 86.98% of Laps ran in Top15, Avg. Driver Rating 107.1(1st), Best 2nd, Worst 30th, Laps Completed 96.72%, Led 11.39% of laps he ran, 0 Wins, 0 Poles, 3 Top 3’s, 4 Top 5’s, 6 Top 10’s, 8 Top 15’s, 1 Finish out of Top 20, 1 DNF, 2 Stage Wins, 5.2 Stage Pts Per Stage
- Las Vegas Statistics
- 2022 Fall Las Vegas Race
- Finished 2nd, Started 11th, Led 68 laps (24.47%), Finished 4th in Stage 2, ran 262 Laps in Top15 (98.13% of laps he ran), had 122.7 Driver Rating
- Notable Las Vegas Statistics (Ranks are of drivers with 1+ start this year)
- 9 Races
- 21.22 Avg. Finish (Ranks 22nd)
- Best Finish: 2nd, Worst: 33rd
- Completed 99.01% of laps (% ranks 11th)
- 30.28% of Laps ran in Top15 (% ranks 22nd)
- 65.83 Average Driver Rating (Ranks 21st)
- Led 6.32% of laps he’s run (% ranks 5th)
- 0 Wins
- 1 Top 2, 11.11% (% ranks 8th)
- 2 Top 3’s, 22.22% (% ranks 5th)
- 2 Top 15’s, 22.22% (% ranks 24th)
- 6 finishes outside Top 20, 66.67% (% ranks T26th)
- 0 DNF’s, 0.00% (% ranks T1st)
- 1 Stage Win, 5.56% (% ranks T8th)
- 4 Stage Top 10’s, 22.22% (% ranks 16th)
Ross Chastain may be 1st in points but is notable because of his race last Fall here at Las Vegas. Last week Chastain won both stages but fell short of a win, on the season he has the most Stage Wins (3) and Stage Pts (30). The only really bad 2023 stat for Chastain so far is his Top15% as he has only ran 58.5% of his laps inside the Top 15 which is 11th in the 2023 ranks above. After Auto Club Chastain rides a 6 race Top 10 streak (longest active streak) and this streak could be 7 after this weekend. Chastain had 6 Top 10’s and only 1 finish outside the Top 20 in 10 Intermediate races last year and led to him having the 4th best Avg. Finish at 10.4. In fact Chastain’s 107.1 Avg. Driver Rating at Intermediates was the best of anyone last year as was his 5.2 Stage Pts Per Stage. In the last race here at Vegas Chastain came so close to victory but ended up 2nd after leading a quarter of the race and being in the Top 15 for all but 5 laps. In this race Chastain also had a 122.7 Driver Rating which was well above his 65.83 average here. Chastain has 9 races here and has 2 Top 3’s, but those are his only Top 15’s as well. In addition he has 6 finishes outside the Top 20, but these were all in subpar equipment so it is hard to say these stats are accurate. This weekend I expect more of what Chastain did at Auto Club, for him to be in the Top 15 a lot, and get a Top 10 at the end of the day with a possibility for a Top 5 or maybe a Win.
2nd in Points – Joey Logano
| Category | Statistic | 2023 Rank | ªRank Thru 2 Races |
| Avg. Fin.¹ | 6.0 | T2nd of 41 | T46th of 915 |
| Completed Laps%¹ | 100% | T1st of 41 | T1st of 915 |
| Laps in Top15%¹ | 83.01% | 2nd of 41 | 85th of 868‡ |
| Avg. Driver Rating¹ | 107.25 | 1st of 41 | 39th of 868‡ |
| Wins | 0 | T3rd of 41 | T40th of 915 |
| Poles | 0 | T2nd of 41 | T37th of 915 |
| Top 2’s | 1 | T1st of 41 | T6th of 915 |
| Top 3’s | 1 | T1st of 41 | T11th of 915 |
| Top 5’s | 1 | T1st of 41 | T25th of 915 |
| Top 10’s | 2 | T1st of 41 | T1st of 915 |
| DNF’s¹ | 0 | T1st of 41 | T1st of 915 |
| Stage Wins | 0 | T3rd of 41 | T19th of 301* |
| Stage T10s | 3 | T1st of 41 | T15th of 301* |
| Stage Pts | 19 | 2nd of 41 | T20th of 301* |
| Playoff Pts² | 0 | T5th of 41 | T31st of 301* |
ªSince Playoffs started in 2004
¹Ranks of drivers to start 40% of races thru 2 races
²Earned from races only
*Stage racing started in 2017
‡Loop Data started in 2005, max Driver Rating is 150.0
- Notable Streaks this/last year
- 4 straight Top 10 finishes (active streak)
- 2022 Intermediate Track Stats (Avg. Fin. and Driver Rating rank among drivers with 1+ Intermediate Track start, 45 drivers)
- 10 Races, Avg. Finish 10.3(2nd), 85.69% of Laps ran in Top15, Avg. Driver Rating 98.54(3rd), Best 1st, Worst 20th, Laps Completed 99.7%, Led 7.66% of laps he ran, 2 Wins, 2 Poles, 3 Top 3’s, 4 Top 5’s, 5 Top 10’s, 6 Top 15’s, 0 Finishes out of Top 20, 1 DNF, 1 Stage Win, 3.65 Stage Pts Per Stage
- Las Vegas Statistics
- 2022 Fall Las Vegas Race
- Finished 1st, Started 5th, Led 32 laps (11.99%), Finished 2nd in Stage 1 and 2nd in Stage 2, ran 266 Laps in Top15 (99.63% of laps he ran), had 130.6 Driver Rating
- Notable Las Vegas Statistics (Ranks are of drivers with 1+ start this year)
- 19 Races
- 8.47 Avg. Finish (Ranks 1st)
- Best Finish: 1st, Worst: 23rd
- Completed 99.98% of laps (% ranks 4th)
- 80.56% of Laps ran in Top15 (% ranks 3rd)
- 103.23 Average Driver Rating (Ranks 1st)
- Led 10.33% of laps he’s run (% ranks 1st)
- 3 Wins, 15.79% (% ranks T2nd)
- 4 Top 2’s, 21.05% (% ranks 4th)
- 7 Top 5’s, 36.84% (% ranks 5th)
- 12 Top 10’s, 63.16% (% ranks T2nd)
- 17 Top 15’s, 89.47% (% ranks 2nd)
- 1 finish outside Top 20, 5.26% (% ranks 3rd)
- 0 DNF’s, 0.00% (% ranks T1st)
- 2 Stage Wins, 9.09% (% ranks T5th)
- 17 Stage Top 10’s, 77.27% (% ranks 3rd)
- 5.27 Stage Pts Per Stage (Ranks 2nd)
Joey Logano is notable because of his outstanding numbers here at Las Vegas. Last week Joey ran up front most of the race but ultimately dropped back late and finished 10th. This was his 2nd Top 10 this year and he is 1 of only 4 drivers who can say that. Logano’s worst 2023 rank above is Playoff Points where he has 0 and ranks T5th, but other than that his stats are stellar as he ranks no worst than 3rd in any other category and even has the best Avg. Driver Rating at 107.25. His 10th at Auto Club also was his 4th straight Top 10, which is the 2nd longest active streak. In 10 Intermediate races last year Logano had 2 Wins and 5 Top 10’s with 0 finishes outside the Top 20, but also 4 finishes between 16th and 20th. This all led Logano to a 10.3 Avg. Finish (2nd best) and a 98.54 Avg. Driver Rating (3rd best). In the Fall race here Logano bested Ross Chastain late to pull off the win after leading 32 laps, finishing 2nd in both stages, and only being outside the Top 15 for 1 lap. This fits very well with his overall stats here as Logano’s 8.47 Avg. Finish and 103.23 Avg. Driver Rating are the best among active drivers. In total he has completed 99.98% of the laps here and has 3 wins in 19 starts. In addition Logano has 17 Top 15’s and finished in the Top 10 in over 60% of his races here. Taking this all in Logano should be considered the favorite this weekend and I think he get another Top 5 this year and battles for the win.
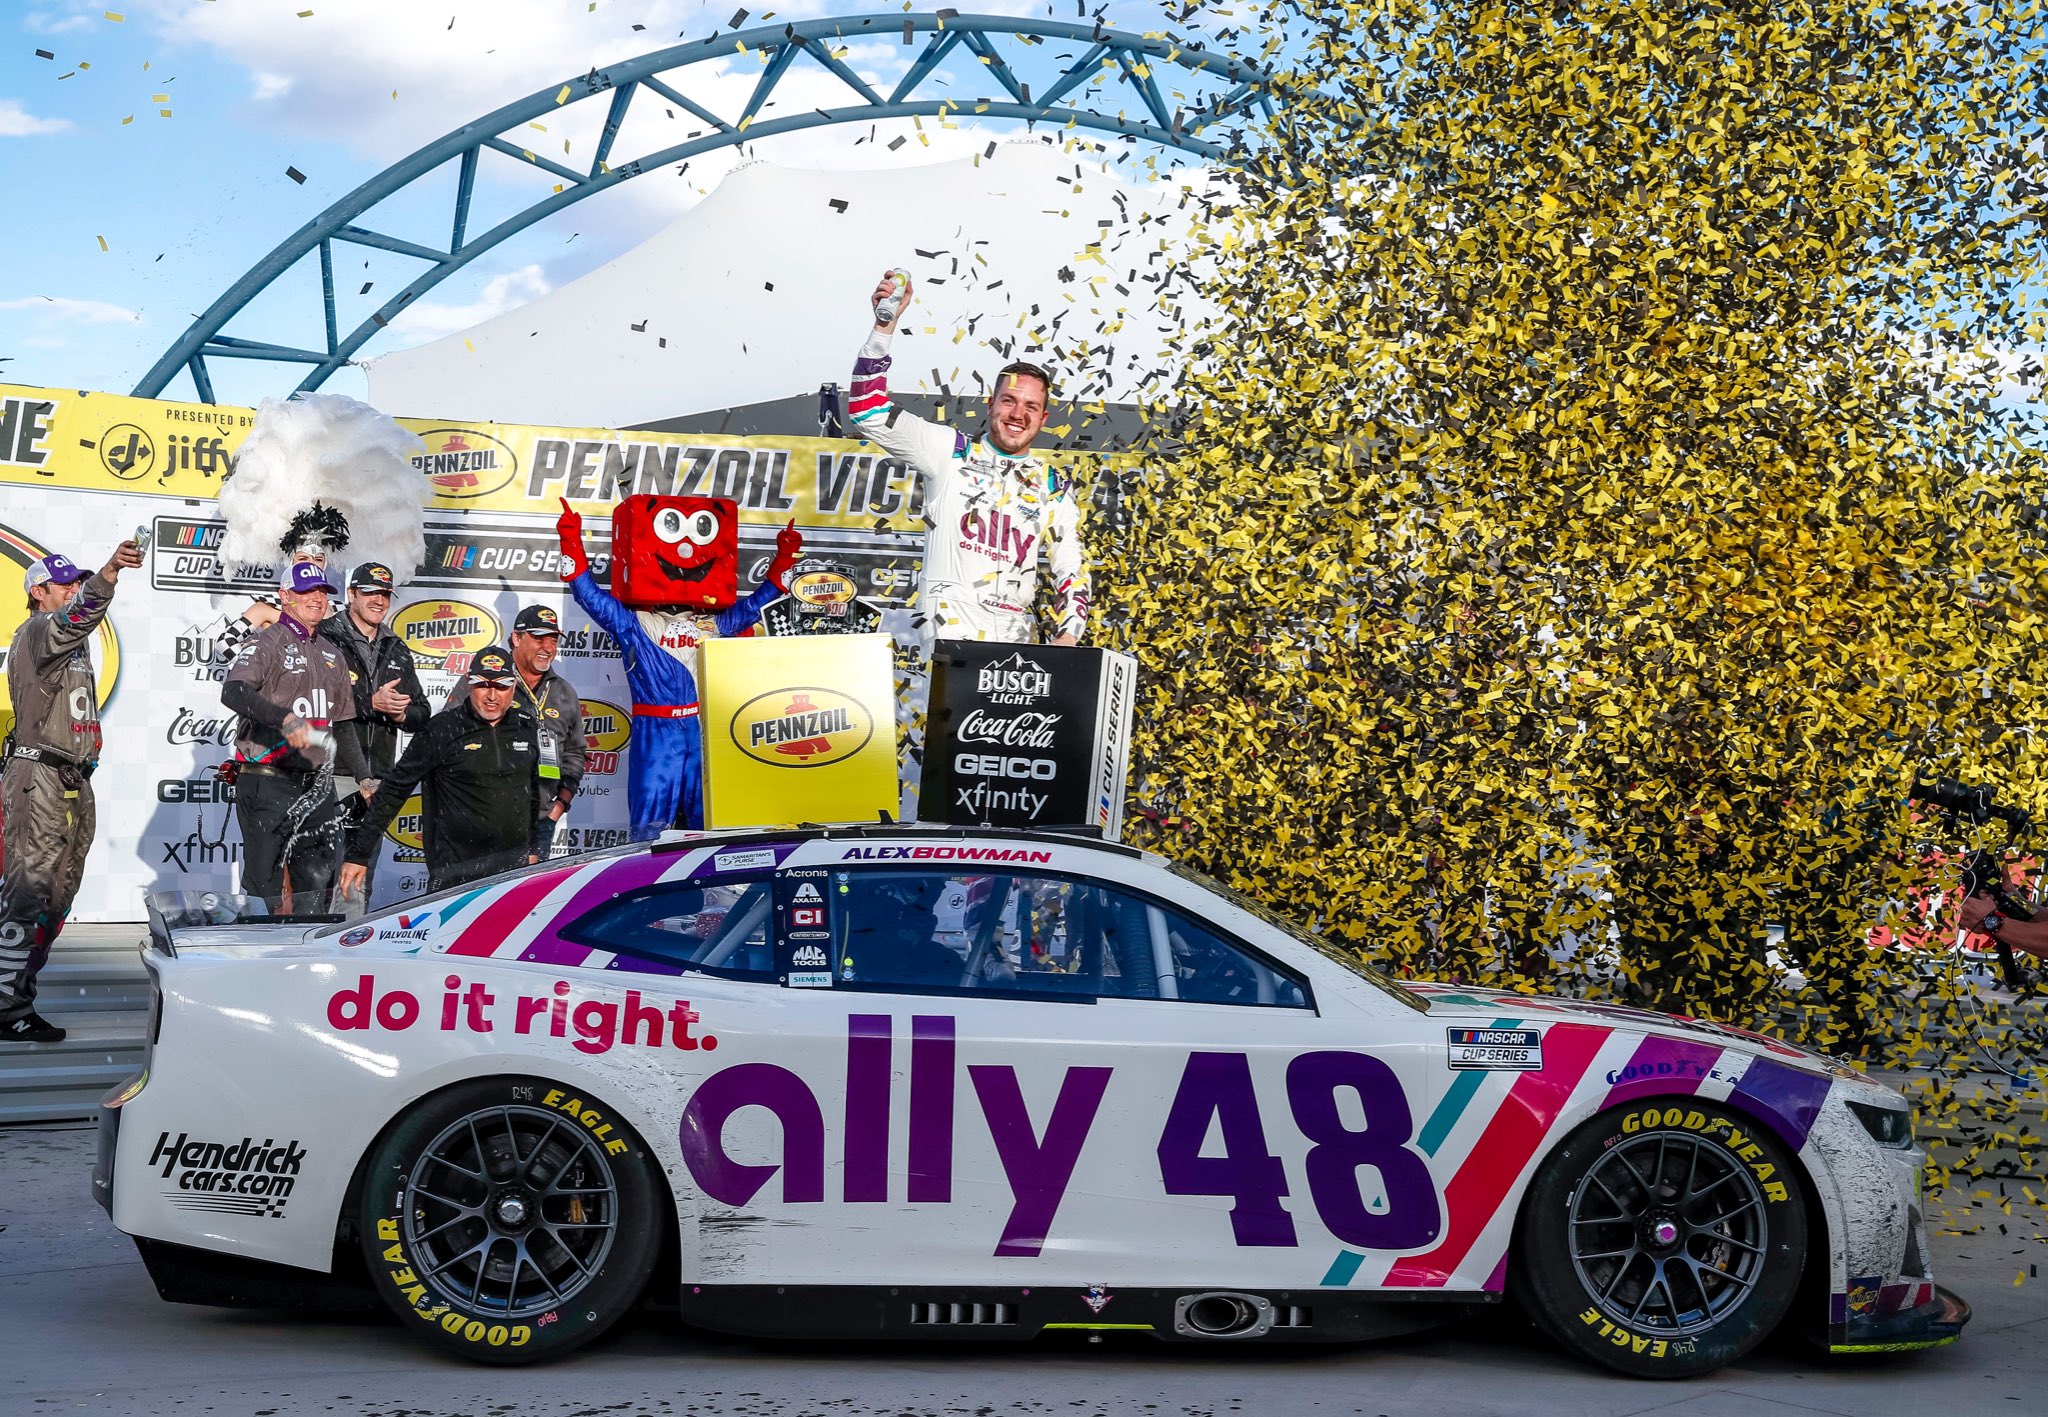
3rd in Points – Alex Bowman
| Category | Statistic | 2023 Rank | ªRank Thru 2 Races |
| Avg. Fin.¹ | 6.5 | T4th of 41 | T52nd of 915 |
| Completed Laps%¹ | 100% | T1st of 41 | T1st of 915 |
| Laps in Top15%¹ | 69.9% | 6th of 41 | 165th of 868‡ |
| Avg. Driver Rating¹ | 92.85 | 6th of 41 | 135th of 868‡ |
| Wins | 0 | T3rd of 41 | T40th of 915 |
| Poles | 1 | T1st of 41 | T1st of 915 |
| Top 2’s | 0 | T5th of 41 | T76th of 915 |
| Top 3’s | 0 | T7th of 41 | T111th of 915 |
| Top 5’s | 1 | T1st of 41 | T25th of 915 |
| Top 10’s | 2 | T1st of 41 | T1st of 915 |
| DNF’s¹ | 0 | T1st of 41 | T1st of 915 |
| Stage Wins | 0 | T3rd of 41 | T19th of 301* |
| Stage T10s | 3 | T1st of 41 | T15th of 301* |
| Stage Pts | 19 | T2nd of 41 | T20th of 301* |
| Playoff Pts² | 0 | T5th of 41 | T31st of 301* |
ªSince Playoffs started in 2004
¹Ranks of drivers to start 40% of races thru 2 races
²Earned from races only
*Stage racing started in 2017
‡Loop Data started in 2005, max Driver Rating is 150.0
- Notable Streaks this/last year
- 2 straight Top 10 finishes (active streak)
- 2022 Intermediate Track Stats (Avg. Fin. and Driver Rating rank among drivers with 1+ Intermediate Track start, 45 drivers)
- 8 Races, Avg. Finish 16.0(14th), 60.51% of Laps ran in Top15, Avg. Driver Rating 80.5(14th), Best 1st, Worst 36th, Laps Completed 88.31%, Led 5.54% of laps he ran, 1 Win, 0 Poles, 1 Top 3, 2 Top 5’s, 5 Top 10’s, 5 Top 15’s, 3 Finishes out of Top 20, 2 DNF’s, 2 Stage Wins, 1.69 Stage Pts Per Stage
- Las Vegas Statistics
- 2022 Spring Las Vegas Race
- Finished 1st, Started 13th, Led 16 laps (5.84%), Finished 1st in Stage 1, ran 245 Laps in Top15 (89.42% of laps he ran), had 118.2 Driver Rating
- Notable Las Vegas Statistics (Ranks are of drivers with 1+ start this year)
- 11 Races
- 18.18 Avg. Finish (Ranks 16th)
- Best Finish: 1st, Worst: 43rd
- Completed 91.39% of laps (% ranks 30th)
- 68.95% of Laps ran in Top15 (% ranks 10th)
- 80.5 Average Driver Rating (Ranks 12th)
- Led 0.78% of laps he’s run (% ranks 21st)
- 1 Win, 9.09% (% ranks T4th)
- 1 Top 3, 9.09% (% ranks 11th)
- 2 Top 5’s, 18.18% (% ranks 13th)
- 5 Top 15’s, 45.45% (% ranks 17th)
- 4 finishes outside Top 20, 36.36% (% ranks 14th)
- 1 DNF, 9.09% (% ranks T22nd)
- 1 Stage Win, 5.56% (% ranks T8th)
- 11 Stage Top 10’s, 61.11% (% ranks 7th)
Alex Bowman is notable because of his 3rd place points position so far through the season. Bowman hasn’t been flashy in 2023 so far having 0 Top 3’s, but he has been consistent as you can tell from his 6.5 Avg. Finish. In addition his Avg. Driver Rating of 92.85 and 69.9% of laps ran in the Top 15 rank of 6th in the 2023 ranks above. To go along with this Bowman is tied for the 2nd most Stage Pts with 19. Last year Bowman ran 8 Intermediate races and those went not so good. Bowman averaged a 16.0 finish and an 80.5 Driver Rating, both of which ranked 14th, in those 8 races and only had 2 Top 5’s to 3 finishes outside the Top 20. The good news is that one of those Top 5’s was a win and that win came in his last start here at Las Vegas. Bowman was out with a concussion at the Fall Vegas race but last Spring Bowman beat Kyle Larson on a late restart to win. In that race he led 16 laps and won Stage 1 while having the 2nd best Driver Rating only behind Ross Chastain, he was also in the Top 15 for almost 90% of the race as well. This isn’t typical of Bowman here though as he has only 2 Top 5’s in 11 races leading to a 18.18 Avg. Finish. Bowman does have 5 Top 15’s however to 4 finishes outside the Top 20. With this said I don’t see another win for Bowman, however I wouldn’t be surprised if he gets a Top 5 but if it’s not a Top 5 it’s probably outside the Top 15.
5th in Points – Daniel Suarez
| Category | Statistic | 2023 Rank | ªRank Thru 2 Races |
| Avg. Fin.¹ | 5.5 | 1st of 41 | T41st of 915 |
| Completed Laps%¹ | 100% | T1st of 41 | T1st of 915 |
| Laps in Top15%¹ | 58.98% | 11th of 41 | 230th of 868‡ |
| Avg. Driver Rating¹ | 92.0 | 7th of 41 | T144th of 868‡ |
| Wins | 0 | T3rd of 41 | T40th of 915 |
| Poles | 0 | T2nd of 41 | T37th of 915 |
| Top 2’s | 0 | T5th of 41 | T76th of 915 |
| Top 3’s | 0 | T7th of 41 | T111th of 915 |
| Top 5’s | 1 | T1st of 41 | T25th of 915 |
| Top 10’s | 2 | T1st of 41 | T1st of 915 |
| DNF’s¹ | 0 | T1st of 41 | T1st of 915 |
| Stage Wins | 0 | T3rd of 41 | T19th of 301* |
| Stage T10s | 2 | T6th of 41 | T37th of 301* |
| Stage Pts | 14 | 5th of 41 | T40th of 301* |
| Playoff Pts² | 0 | T5th of 41 | T31st of 301* |
ªSince Playoffs started in 2004
¹Ranks of drivers to start 40% of races thru 2 races
²Earned from races only
*Stage racing started in 2017
‡Loop Data started in 2005, max Driver Rating is 150.0
- Notable Streaks this/last year
- 2 straight Top 10 finishes (active streak)
- 2022 Intermediate Track Stats (Avg. Fin. and Driver Rating rank among drivers with 1+ Intermediate Track start, 45 drivers)
- 10 Races, Avg. Finish 18.6(19th), 62.14% of Laps ran in Top15, Avg. Driver Rating 77.6(16th), Best 10th, Worst 37th, Laps Completed 91.47%, Led 2.72% of laps he ran, 0 Wins, 0 Poles, 0 Top 3’s, 0 Top 5’s, 3 Top 10’s, 5 Top 15’s, 3 Finishes out of Top 20, 2 DNF’s, 1 Stage Win, 2.35 Stage Pts Per Stage
- Las Vegas Statistics
- 2022 Fall Las Vegas Race
- Finished 16th, Started 6th, Led 31 laps (11.61%), Finished 3rd in Stage 1 and 3rd in Stage 2, ran 190 Laps in Top15 (71.16% of laps he ran), had 96.0 Driver Rating
- Notable Las Vegas Statistics (Ranks are of drivers with 1+ start this year)
- 11 Races
- 22.18 Avg. Finish (Ranks 26th)
- Best Finish: 8th, Worst: 37th
- Completed 93.32% of laps (% ranks 27th)
- 29.2% of Laps ran in Top15 (% ranks 23rd)
- 60.67 Average Driver Rating (Ranks 25th)
- Led 3.05% of laps he’s run (% ranks 11th)
- 0 Top 5’s
- 1 Top 10, 9.09% (% ranks 24th)
- 2 Top 15’s, 18.18% (% ranks 25th)
- 5 finishes outside Top 20, 45.45% (% ranks T16th)
- 1 DNF, 9.09% (% ranks T22nd)
- 0 Stage Wins
- 4 Stage Top 10’s, 18.18% (% ranks T17th)
Daniel Suarez is notable because of his good stats to start out the 2023 season. So far Suarez sits 5th in points and has the best Avg. Finish of any driver at 5.5. His Avg. Driver Rating isn’t shabby at 92.0 which ranks 7th best, however his Laps in Top15% ranks 11th best which isn’t as good. From here the news only gets worst for Suarez fans though as last year he ran 10 Intermediate races and had a best finish of 10th (3 times). In fact his 18.6 Avg. Finish was only good for 19th best and he ran only 62.14% of his laps inside the Top 15. Good news for Suarez fans is that he did have 2.35 Stage Pts Per Stage, so he does get Stage Pts at least. In the Fall Las Vegas race Suarez ran 71.16% of his laps in the Top 15 but ultimately ended up 16th after finishing 3rd in both stages. Overall here at Vegas Suarez’s stats aren’t any better as he has an Avg. Finish of 22.18 in 11 races with only 1 Top 10 and 2 Top 15’s. In addition Suarez has only ran 29.2% of his laps here inside the Top 15 and has an Avg. Driver Rating that is a tick above 60. Based on the stats it is hard to see Suarez having a good day, but I see him doing a bit better than he has here in the past. I see him running Top 15 for 75% of his laps and coming home with a finish between 10th and 20th.
8th in Points – Kyle Busch
| Category | Statistic | 2023 Rank | ªRank Thru 2 Races |
| Avg. Fin.¹ | 10.0 | T8th of 41 | T121st of 915 |
| Completed Laps%¹ | 99.76% | T14th of 41 | T301st of 915 |
| Laps in Top15%¹ | 69.17% | 7th of 41 | 169th of 868‡ |
| Avg. Driver Rating¹ | 93.95 | 5th of 41 | 128th of 868‡ |
| Wins | 1 | T1st of 41 | T2nd of 915 |
| Poles | 0 | T2nd of 41 | T37th of 915 |
| Top 2’s | 1 | T1st of 41 | T6th of 915 |
| Top 3’s | 1 | T1st of 41 | T11th of 915 |
| Top 5’s | 1 | T1st of 41 | T25th of 915 |
| Top 10’s | 1 | T5th of 41 | T66th of 915 |
| DNF’s¹ | 1 | T23rd of 41 | T612th of 915 |
| Stage Wins | 0 | T3rd of 41 | T19th of 301* |
| Stage T10s | 1 | T12th of 41 | T88th of 301* |
| Stage Pts | 9 | T9th of 41 | T69th of 301* |
| Playoff Pts² | 5 | T1st of 41 | T3rd of 301* |
ªSince Playoffs started in 2004
¹Ranks of drivers to start 40% of races thru 2 races
²Earned from races only
*Stage racing started in 2017
‡Loop Data started in 2005, max Driver Rating is 150.0
- Notable Streaks this/last year
- 1 straight Top 10 finish
- 2022 Intermediate Track Stats (Avg. Fin. and Driver Rating rank among drivers with 1+ Intermediate Track start, 45 drivers)
- 10 Races, Avg. Finish 16.7(15th), 75.32% of Laps ran in Top15, Avg. Driver Rating 90.76(10th), Best 2nd, Worst 36th, Laps Completed 85.7%, Led 12.67% of laps he ran, 0 Wins, 0 Poles, 3 Top 3’s, 4 Top 5’s, 5 Top 10’s, 5 Top 15’s, 5 Finishes out of Top 20, 3 DNF’s, 2 Stage Wins, 3.35 Stage Pts Per Stage
- Las Vegas Statistics
- 2022 Fall Las Vegas Race
- Finished 3rd, Started 18th, Led 0 laps, Finished 10th in Stage 2, ran 205 Laps in Top15 (76.78% of laps he ran), had 101.5 Driver Rating
- Notable Las Vegas Statistics (Ranks are of drivers with 1+ start this year)
- 23 Races
- 10.83 Avg. Finish (Ranks 3rd)
- Best Finish: 1st, Worst: 41st
- Completed 93.23% of laps (% ranks 28th)
- 80.06% of Laps ran in Top15 (% ranks 4th)
- 101.39 Average Driver Rating (Ranks 3rd)
- Led 5.4% of laps he’s run (% ranks 9th)
- 1 Win, 4.35% (% ranks 9th)
- 8 Top 3’s, 34.78% (% ranks 3rd)
- 11 Top 5’s, 47.83% (% ranks 1st)
- 14 Top 10’s, 60.87% (% ranks 5th)
- 18 Top 15’s, 78.26% (% ranks 3rd)
- 4 finishes outside Top 20, 17.39% (% ranks 6th)
- 2 DNF’s, 8.7% (% ranks 21st)
- 0 Stage Wins
- 13 Stage Top 10’s, 59.09% (% ranks 9th)
Kyle Busch could be notable for many reasons but is notable because of his 2023 season stats. Last week Busch won at Auto Club and had a fast car all day long which got him his 1st win on the young season. That now puts Busch’s Avg. Finish at 10.0 and he has the 5th best Avg. Driver Rating at 93.95. In addition Busch has ran nearly 70% of his laps inside the Top 15 this season but only has 1 Stage Top 10 to show for it. Last year at Intermediate tracks Busch was feast or famine as he had 5 Top 10’s but also 5 finishes outside the Top 20 with 3 DNF’s. Overall his 16.7 Avg. Finish was 15th best but he did run 75% of his laps inside the Top 15 and his 90.76 Avg. Driver Rating ranked 10th. One of his 5 good races was at Las Vegas last Fall when he finished 3rd, ran 76.78% of his laps in the Top 15 and had a 101.5 Avg. Driver Rating. However when it comes to overall stats here the stats are scary, scary for the competition that is. In 23 races Busch has a 10.83 Avg. Finish with 1 win, but he has a Top 3 in 34.78% of his starts and a Top 5 in almost half of his starts which is the best percentage among active drivers. Overall it seems Busch’s hot streak could continue and I think for sure he gets a Top 10 and probably a Top 5 at that, but he will fall a little short of a win though.
9th in Points – Denny Hamlin
| Category | Statistic | 2023 Rank | ªRank Thru 2 Races |
| Avg. Fin.¹ | 11.5 | 11th of 41 | T151st of 915 |
| Completed Laps%¹ | 100% | T1st of 41 | T1st of 915 |
| Laps in Top15%¹ | 86.17% | 1st of 41 | 68th of 868‡ |
| Avg. Driver Rating¹ | 100.05 | 3rd of 41 | 88th of 868‡ |
| Wins | 0 | T3rd of 41 | T40th of 915 |
| Poles | 0 | T2nd of 41 | T37th of 915 |
| Top 2’s | 0 | T5th of 41 | T76th of 915 |
| Top 3’s | 0 | T7th of 41 | T111th of 915 |
| Top 5’s | 0 | T11th of 41 | T177th of 915 |
| Top 10’s | 1 | T5th of 41 | T66th of 915 |
| DNF’s¹ | 0 | T1st of 41 | T1st of 915 |
| Stage Wins | 0 | T3rd of 41 | T19th of 301* |
| Stage T10s | 2 | T6th of 41 | T37th of 301* |
| Stage Pts | 11 | 7th of 41 | T54th of 301* |
| Playoff Pts² | 0 | T5th of 41 | T31st of 301* |
ªSince Playoffs started in 2004
¹Ranks of drivers to start 40% of races thru 2 races
²Earned from races only
*Stage racing started in 2017
‡Loop Data started in 2005, max Driver Rating is 150.0
- Notable Streaks this/last year
- 1 straight Top 10 finishes (active streak)
- 2022 Intermediate Track Stats (Avg. Fin. and Driver Rating rank among drivers with 1+ Intermediate Track start, 45 drivers)
- 10 Races, Avg. Finish 9.0(1st), 84.26% of Laps ran in Top15, Avg. Driver Rating 101.99(2nd), Best 1st, Worst 32nd, Laps Completed 98.16%, Led 7.32% of laps he ran, 1 Win, 2 Poles, 3 Top 3’s, 5 Top 5’s, 8 Top 10’s, 8 Top 15’s, 2 Finishes out of Top 20, 1 DNF, 0 Stage Wins, 3.6 Stage Pts Per Stage
- Las Vegas Statistics
- 2022 Fall Las Vegas Race
- Finished 5th, Started 31st, Led 5 laps (1.87%), Finished 5th in Stage 2, ran 197 Laps in Top15 (73.78% of laps he ran), had 93.4 Driver Rating
- Notable Las Vegas Statistics (Ranks are of drivers with 1+ start this year)
- 22 Races
- 12.86 Avg. Finish (Ranks 9th)
- Best Finish: 1st, Worst: 32nd
- Completed 98.56% of laps (% ranks 14th)
- 63.54% of Laps ran in Top15 (% ranks 12th)
- 90.08 Average Driver Rating (Ranks 10th)
- Led 6.17% of laps he’s run (% ranks 7th)
- 1 Win, 4.55% (% ranks 8th)
- 3 Top 2’s, 13.64% (% ranks 10th)
- 6 Top 5’s, 27.27% (% ranks 8th)
- 11 Top 10’s, 50.0% (% ranks T7th)
- 3 finishes outside Top 20, 13.64% (% ranks 4th)
- 2 DNF’s, 9.09% (% ranks T22nd)
- 2 Stage Wins, 9.09% (% ranks T5th)
- 3.82 Stage Pts Per Stage (Ranks 7th)
Denny Hamlin is notable because of his stats last year on Intermediate tracks. Last week Hamlin got his 1st Top 10 of the year finishing 6th and ran well most of the race. In total Hamlin has an 11.5 Avg. Finish with a 100.05 Avg. Driver Rating (ranks 3rd) and has ran 86.17% of his laps this year inside the Top 15 (ranks 1st). These numbers could get even better if Hamlin performs this week like he did at the 10 Intermediate tracks last year. In these 10 races Hamlin had a series best 9.0 Avg. Finish and a 101.99 Avg. Driver Rating, which ranked 2nd best. While Hamlin only had 1 Win he did get 3 Top 3’s, 5 Top 5’s and 8 Top 10’s, but his other 2 races were finishes outside the Top 20. In addition to this he also had 2 Poles and was in the Top 15 for 84.26% of the laps he ran. Last Fall at Las Vegas 5’s were wild for Hamlin as he led 5 laps, finished 5th in Stage 2, and finish 5th in the race. He also had a 93.4 Driver Rating and was in the Top 15 for a little less than 75% of the laps he ran. In all this is about typical for Hamlin at Vegas as he has a 12.86 Avg. Finish and a 90.08 Avg. Driver Rating which rank 9th and 10th respectively. In his 22 races here he only has 1 Win but has finished half of his races inside the Top 10 and only has 3 finishes outside the Top 20. With all that said I expect Sunday to be more success for Hamlin and while he doesn’t win I do think he gets a Top 5 and battles for the win.
11th in Points – Martin Truex Jr.
| Category | Statistic | 2023 Rank | ªRank Thru 2 Races |
| Avg. Fin.¹ | 13.0 | T12th of 41 | T194th of 915 |
| Completed Laps%¹ | 100% | T1st of 41 | T1st of 915 |
| Laps in Top15%¹ | 57.28% | 12th of 41 | 242nd of 868‡ |
| Avg. Driver Rating¹ | 82.15 | 11th of 41 | 235th of 868‡ |
| Wins | 0 | T3rd of 41 | T40th of 915 |
| Poles | 0 | T2nd of 41 | T37th of 915 |
| Top 2’s | 0 | T5th of 41 | T76th of 915 |
| Top 3’s | 0 | T7th of 41 | T111th of 915 |
| Top 5’s | 0 | T11th of 41 | T177th of 915 |
| Top 10’s | 0 | T17th of 41 | T336th of 915 |
| DNF’s¹ | 0 | T1st of 41 | T1st of 915 |
| Stage Wins | 0 | T3rd of 41 | T19th of 301* |
| Stage T10s | 3 | T1st of 41 | T15th of 301* |
| Stage Pts | 9 | T9th of 41 | T69th of 301* |
| Playoff Pts² | 0 | T5th of 41 | T31st of 301* |
ªSince Playoffs started in 2004
¹Ranks of drivers to start 40% of races thru 2 races
²Earned from races only
*Stage racing started in 2017
‡Loop Data started in 2005, max Driver Rating is 150.0
- Notable Streaks this/last year
- none
- 2022 Intermediate Track Stats (Avg. Fin. and Driver Rating rank among drivers with 1+ Intermediate Track start, 45 drivers)
- 10 Races, Avg. Finish 15.2(T12th), 85.38% of Laps ran in Top15, Avg. Driver Rating 97.49(4th), Best 5th, Worst 31st, Laps Completed 95.8%, Led 7.74% of laps he ran, 0 Wins, 0 Poles, 0 Top 3’s, 1 Top 5, 5 Top 10’s, 6 Top 15’s, 4 Finishes out of Top 20, 3 DNF’s, 2 Stage Wins, 4.9 Stage Pts Per Stage
- Las Vegas Statistics
- 2022 Fall Las Vegas Race
- Finished 7th, Started 27th, Led 0 laps, Finished 8th in Stage 1 and 8th in Stage 2, ran 186 Laps in Top15 (69.66% of laps he ran), had 87.0 Driver Rating
- Notable Las Vegas Statistics (Ranks are of drivers with 1+ start this year)
- 22 Races
- 10.14 Avg. Finish (Ranks 2nd)
- Best Finish: 1st, Worst: 32nd
- Completed 99.93% of laps (% ranks 5th)
- 75.24% of Laps ran in Top15 (% ranks 7th)
- 98.14 Average Driver Rating (Ranks 5th)
- Led 5.1% of laps he’s run (% ranks 10th)
- 2 Wins, 9.09% (% ranks T4th)
- 4 Top 3’s, 18.18% (% ranks 7th)
- 7 Top 5’s, 31.82% (% ranks T6th)
- 13 Top 10’s, 59.09% (% ranks 6th)
- 17 Top 15’s, 77.27% (% ranks 4th)
- 1 finish outside Top 20, 4.55% (% ranks 2nd)
- 0 DNF’s, 0.00% (% ranks T1st)
- 4 Stage Wins, 18.18% (% ranks 1st)
- 21 Stage Top 10’s, 95.45% (% ranks 1st)
- 5.68 Stage Pts Per Stage (Ranks 1st)
Martin Truex Jr. is notable because of how good his stats are in general at Las Vegas. Last week Truex struggled to an 11th place finish and is still in search of his 1st Top 10 this year. On the year Truex has an 82.15 Avg. Driver Rating, a 13.0 Avg. Finish, and has only been in the Top 15 for 57.28% of his laps; these three stats rank either 11th or 12th respectively. Other than that there isn’t much to say about Truex’s 2023 season, but there could be some bit of hope on the horizon for him. In 10 races on Intermediates last year he had only 1 Top 5 but did have 5 Top 10’s. Unfortunately for Truex he had 4 finishes outside the Top 20 as well though which led him to getting a 15.2 Avg. Finish. The good news for Truex is that 3 of the 4 finishes outside the Top 20 were DNF’s, his 97.49 Avg. Driver Rating was the 4th best, and he had 4.9 Stage Pts Per Stage. For the Fall race here at Las Vegas Truex finished 8th in both stages and 7th in the race. In general at Las Vegas Truex is typically better as he has 5.68 Stage Pts Per Stage and has gotten a stage T10 in over 95% of the stages he’s run. In addition Truex has 2 Wins, the 2nd best active Avg. Finish at 10.14, and all of his Las Vegas stats above rank 10th or better which shows his consistency. When you take this all in it’s easy to see that Truex will probably get his first Top 10 of the year this weekend, but a Top 5 is a little harder to see and I don’t think will happen.
24th in Points – Kyle Larson
| Category | Statistic | 2023 Rank | ªRank Thru 2 Races |
| Avg. Fin.¹ | 23.5 | 28th of 41 | T506th of 915 |
| Completed Laps%¹ | 96.12% | 30th of 41 | 605th of 915 |
| Laps in Top15%¹ | 38.11% | 21st of 41 | 344th of 868‡ |
| Avg. Driver Rating¹ | 69.5 | 17th of 41 | 392nd of 868‡ |
| Wins | 0 | T3rd of 41 | T40th of 915 |
| Poles | 0 | T2nd of 41 | T37th of 915 |
| Top 2’s | 0 | T5th of 41 | T76th of 915 |
| Top 3’s | 0 | T7th of 41 | T111th of 915 |
| Top 5’s | 0 | T11th of 41 | T177th of 915 |
| Top 10’s | 0 | T17th of 41 | T336th of 915 |
| DNF’s¹ | 1 | T23rd of 41 | T612th of 915 |
| Stage Wins | 0 | 3rd of 41 | T19th of 301* |
| Stage T10s | 0 | T1st of 41 | T15th of 301* |
| Stage Pts | 0 | 25th of 41 | T144th of 301* |
| Playoff Pts² | 0 | 25th of 41 | T141st of 301* |
ªSince Playoffs started in 2004
¹Ranks of drivers to start 40% of races thru 2 races
²Earned from races only
*Stage racing started in 2017
‡Loop Data started in 2005, max Driver Rating is 150.0
- Notable Streaks this/last year
- none
- 2022 Intermediate Track Stats (Avg. Fin. and Driver Rating rank among drivers with 1+ Intermediate Track start, 45 drivers)
- 10 Races, Avg. Finish 11.8(5th), 78.74% of Laps ran in Top15, Avg. Driver Rating 96.24(6th), Best 1st, Worst 36th, Laps Completed 88.39%, Led 13.17% of laps he ran, 1 Win, 0 Poles, 3 Top 3’s, 4 Top 5’s, 7 Top 10’s, 8 Top 15’s, 2 Finishes out of Top 20, 2 DNF’s, 3 Stage Wins, 3.3 Stage Pts Per Stage
- Las Vegas Statistics
- 2022 Fall Las Vegas Race
- Finished 35th (wrecked), Started 14th, Led 0 laps, Finished 7th in Stage 1, ran 91 Laps in Top15 (96.81% of laps he ran), had 54.8 Driver Rating
- Notable Las Vegas Statistics (Ranks are of drivers with 1+ start this year)
- 13 Races
- 11.15 Avg. Finish (Ranks 5th)
- Best Finish: 1st, Worst: 35th
- Completed 94.86% of laps (% ranks T24th)
- 75.91% of Laps ran in Top15 (% ranks 6th)
- 97.31 Average Driver Rating (Ranks 7th)
- Led 7.6% of laps he’s run (% ranks 4th)
- 1 Win, 7.69% (% ranks 6th)
- 4 Top 2’s, 30.77% (% ranks 1st)
- 5 Top 5’s, 38.46% (% ranks T3rd)
- 9 Top 10’s, 69.23% (% ranks 1st)
- 2 finishes outside Top 20, 15.38% (% ranks 5th)
- 1 DNF, 7.69% (% ranks T19th)
- 2 Stage Wins, 10.0% (% ranks 4th)
- 14 Stage Top 10’s, 70.0% (% ranks 5th)
- 4.4 Stage Pts Per Stage (Ranks 6th)
Kyle Larson is notable because of his good Intermediate stats last year. At Auto Club Larson didn’t even have a chance to back up his win from last year as he had electrical issues right away. This really hurt his 2023 season stats as there are lots of goose eggs in the 2023 stats and his 23.5 Avg. Finish is 28th best. The good news is that an Intermediate is coming up. At these tracks last year he had 1 Win, 3 Top 3’s and 7 Top 10’s with an 11.8 Avg. Finish that was good for 5th best. In total Larson ran nearly 80% of his laps inside the Top 15, led 13.17% of the laps he ran, and had the 6th best Avg. Driver Rating at 96.24. He also had 3 Stage Wins and his only finishes outside the Top 15 were DNF’s. At the Fall Las Vegas race Larson was senselessly taken out by Bubba Wallace after finishing 7th in Stage 1 and ended up 35th at the end of the race because of this. However in the Spring Larson finished runner-up to his teammate Alex Bowman and had a 108.9 Driver Rating. Overall here Larson is really good though with an Avg. Finish of 11.15 in 13 races, good for 5th best among active drivers. In fact most of his Las Vegas ranks above are 6th or better, that include his 30.77 Top 2% and his 69.23 Top 10% which both are best among active drivers. This weekend as long as no one wrecks him and his engine holds up I see Larson getting a Top 5 at least, if not a win, but if it’s not a Top 5 then it’s probably a finish outside the Top 15.