
1st in Points – Zane Smith
| Category | Statistic | 2023 Rank | ªRank Thru 2 Races |
| Avg. Fin.¹ | 1.5 | 2nd of 47 | 5th of 338 |
| Completed Laps%¹ | 100% | T1st of 47 | T1st of 338 |
| Laps in Top15%¹ | 79.34% | 8th of 46 | 54th of 337 |
| Avg. Driver Rating¹ | 119.1 | 2nd of 46 | 10th of 337‡ |
| Wins | 1 | T1st of 47 | T2nd of 338 |
| Poles | 0 | T3rd of 47 | T15th of 338 |
| Top 2’s | 2 | T1st of 47 | T1st of 338 |
| Top 3’s | 2 | T1st of 47 | T1st of 338 |
| Top 5’s | 2 | T1st of 47 | T1st of 338 |
| Top 10’s | 2 | T1st of 47 | T1st of 338 |
| DNF’s¹ | 0 | T1st of 47 | T1st of 338 |
| Stage Wins | 1 | T1st of 47 | T9th of 299* |
| Stage T10s | 1 | T13th of 47 | T88th of 299* |
| Stage Pts | 10 | T10th of 47 | T51st of 299* |
| Playoff Pts² | 6 | 1st of 47 | T3rd of 299* |
ªSince Playoffs started in 2016
¹Ranks of drivers to start 43% of races thru 2 races
²Earned from races only
*Stage racing started in 2017
‡Max Driver Rating is 150.0
- Notable Streaks this/last year
- 4 straight Top 2 finishes (active streak, ranks T5th all-time)
- 2022/23 Superspeedway Track Stats (Avg. Fin. and Driver Rating rank among drivers with 1+ Superspeedway Track start, 61 drivers)
- 4 Races, Avg. Finish 6.0(3rd), 68.67% of Laps ran in Top15, Avg. Driver Rating 99.23(3rd), Best 1st, Worst 17th, Laps Completed 100%, Led 5.06% of laps he ran, 2 Wins, 0 Poles, 2 Top 3’s, 3 Top 5’s, 3 Top 10’s, 3 Top 15’s, 0 Finishes out of Top 20, 0 DNF’s, 0 Stage Wins, 2.13 Stage Pts Per Stage
- Atlanta Statistics
- 2022 Atlanta Race
- Finished 5th, Started 25th, Led 0 laps, got 0 Stage T10’s, ran 99 Laps in Top15 (73.33% of laps he ran), had 102.1 Driver Rating
- Notable Atlanta Statistics (Ranks are of drivers with 1+ start this year)
- 3 Races
- 5.33 Avg. Finish (Ranks 2nd)
- Best Finish: 5th, Worst: 6th
- Completed 100% of laps (% ranks T1st)
- 86.78% of Laps ran in Top15 (% ranks 4th)
- 100.6 Average Driver Rating (Ranks 3rd)
- Led 1.25% of laps he’s run (% ranks 12th)
- 0 Top 3’s
- 2 Top 5’s, 66.67% (% ranks 3rd)
- 3 Top 10’s, 100% (% ranks T1st)
- 0 finishes outside Top 20, 0.00% (% ranks T1st)
- 0 DNF’s, 0.00% (% ranks T1st)
- 0 Stage Wins
- 3 Stage Top 10’s, 50.0% (% ranks T8th)
Zane Smith is notable because of how well his 3 career races at Atlanta have gone. In the last Truck race at Las Vegas Smith ran a great race but unfortunately Kyle Busch was in the race so the best he could do was 2nd. Still Smith’s numbers are very good thru 2 races this year. As proof, most of his 2023 Ranks above are 1st or 2nd and the only glaring weakness is his stage stats as he has just 1 Stage T10 and 10 Stage Pts, both of which rank T10th or worse on the year. However Smith is on a 4 race Top 2 streak, which is T5th best all time, and based on his 4 2022/23 drafting track stats this could extend even further. In the 4 races Smith has won half of them (both at Daytona) and has 3 Top 5’s while accumulating a 99.23 Avg. Driver Rating. One of these Top 5’s came at Atlanta last year where he finished 5th and spent 73.33% of his laps inside the Top 15 leading to a 102.1 Driver Rating. This tied Smith’s best finish at Atlanta where in 3 races he has finished either 5th or 6th. In addition he has completed every lap here and 87% of those laps he’s spent in the Top 15. All of this has given Smith a 100.6 Avg. Driver Rating here which is the 3rd best among active drivers. Going into the race based on Smith’s hot streak, in 2023 and at Superspeedways, it’s hard to think he’ll have anything less than a great race. However, I see his Top 2 streak coming to an end finishing between 6th and 10th, but I wouldn’t be surprised if he wins.
2nd in Points – Ty Majeski
| Category | Statistic | 2023 Rank | ªRank Thru 2 Races |
| Avg. Fin.¹ | 5.5 | 4th of 47 | T26th of 338 |
| Completed Laps%¹ | 100% | T1st of 47 | T1st of 338 |
| Laps in Top15%¹ | 88.26% | 5th of 46 | 31st of 337 |
| Avg. Driver Rating¹ | 102.9 | 4th of 46 | 25th of 337‡ |
| Wins | 0 | T3rd of 47 | T16th of 338 |
| Poles | 0 | T3rd of 47 | T15th of 338 |
| Top 2’s | 0 | T4th of 47 | T31st of 338 |
| Top 3’s | 0 | T6th of 47 | T45th of 338 |
| Top 5’s | 1 | T2nd of 47 | T7th of 338 |
| Top 10’s | 2 | T1st of 47 | T1st of 338 |
| DNF’s¹ | 0 | T1st of 47 | T1st of 338 |
| Stage Wins | 0 | T5th of 47 | T21st of 299* |
| Stage T10s | 4 | T1st of 47 | T1st of 299* |
| Stage Pts | 20 | 3rd of 47 | T20th of 299* |
| Playoff Pts² | 0 | T5th of 47 | T23rd of 299* |
ªSince Playoffs started in 2016
¹Ranks of drivers to start 43% of races thru 2 races
²Earned from races only
*Stage racing started in 2017
‡Max Driver Rating is 150.0
- Notable Streaks this/last year
- 2 straight Top 10 finishes (active streak)
- 2022/23 Superspeedway Track Stats (Avg. Fin. and Driver Rating rank among drivers with 1+ Superspeedway Track start, 61 drivers)
- 4 Races, Avg. Finish 9.75(6th), 67.23% of Laps ran in Top15, Avg. Driver Rating 87.28(10th), Best 3rd, Worst 23rd, Laps Completed 100%, Led 6.02% of laps he ran, 0 Wins, 1 Pole, 1 Top 3, 1 Top 5, 3 Top 10’s, 3 Top 15’s, 1 Finish out of Top 20, 0 DNF’s, 0 Stage Wins, 3.13 Stage Pts Per Stage
- Atlanta Statistics
- 2022 Atlanta Race
- Finished 3rd, Started 4th, Led 1 lap (0.74%), Finished 2nd in Stage 2, ran 132 Laps in Top15 (97.78% of laps he ran), had 111.1 Driver Rating
- Notable Atlanta Statistics (Ranks are of drivers with 1+ start this year)
- 2 Races
- 11.0 Avg. Finish (Ranks 8th)
- Best Finish: 3rd, Worst: 19th
- Completed 99.63% of laps (% ranks 14th)
- 66.3% of Laps ran in Top15 (% ranks 11th)
- 91.9 Average Driver Rating (Ranks 10th)
- Led 0.37% of laps he’s run (% ranks 13th)
- 0 Top 2’s
- 1 Top 3, 50.0% (% ranks T3rd)
- 1 Top 15, 50.0% (% ranks T15th)
- 0 finishes outside Top 20, 0.00% (% ranks T1st)
- 0 DNF’s, 0.00% (% ranks T1st)
- 0 Stage Wins
- 2.25 Stage Pts Per Stage (Ranks 9th)
Ty Majeski is notable because of how his 2023 stats are so far this year. Two weeks ago Majeski got his first Top 5 of the year when he brought his 98 truck home 5th at Las Vegas. This together with his 6th place finish at Daytona has given him the 4th best Avg. Finish on the year at 5.5. Majeski also has the 4th best Avg. Driver Rating at 102.9 and the 5th best Laps in Top15% at 88.26, he also has the 3rd most Stage Pts on the year with 20. In the last 4 Superspeedway races Majeski has averaged a 9.75 finish with 3 Top 10’s, but also only 1 Top 5. In that span his Avg. Driver Rating is only 10th best at 87.28 as well, but the race at Talladega last year skews these stats as Majeski didn’t have to run well there and hung out near the back. With that said his 1 Top 5 came at Atlanta last year when he finished 3rd after starting 4th, finishing 2nd in Stage 2 and leading 1 lap. Even better is the fact his Driver Rating of 111.1 was 3rd best in that race and he ran over 97% of the laps inside the Top 15. This race was only Majeski’s 2nd race at Atlanta but was significantly better as his first race he ended up 19th which gives him an 11.0 Avg. Finish and his Avg. Driver Rating is a respectable 91.9. In total the stats are pretty kind to Majeski, especially when looking at the last 4 Superspeedway races. This weekend I think he does well again and ends up with a Top 10 but misses out on a Top 5 this time at Atlanta.
3rd in Points – Christian Eckes
| Category | Statistic | 2023 Rank | ªRank Thru 2 Races |
| Avg. Fin.¹ | 4.5 | 3rd of 47 | T15th of 338 |
| Completed Laps%¹ | 100% | T1st of 47 | T1st of 338 |
| Laps in Top15%¹ | 87.79% | 6th of 46 | 35th of 337 |
| Avg. Driver Rating¹ | 112.65 | 3rd of 46 | 12th of 337‡ |
| Wins | 0 | T3rd of 47 | T16th of 338 |
| Poles | 0 | T3rd of 47 | T15th of 338 |
| Top 2’s | 0 | T4th of 47 | T31st of 338 |
| Top 3’s | 1 | T2nd of 47 | T5th of 338 |
| Top 5’s | 1 | T2nd of 47 | T7th of 338 |
| Top 10’s | 2 | T1st of 47 | T1st of 338 |
| DNF’s¹ | 0 | T1st of 47 | T1st of 338 |
| Stage Wins | 1 | T1st of 47 | T9th of 299* |
| Stage T10s | 2 | T8th of 47 | T43rd of 299* |
| Stage Pts | 16 | T7th of 47 | T35th of 299* |
| Playoff Pts² | 1 | T2nd of 47 | T16th of 299* |
ªSince Playoffs started in 2016
¹Ranks of drivers to start 43% of races thru 2 races
²Earned from races only
*Stage racing started in 2017
‡Max Driver Rating is 150.0
- Notable Streaks this/last year
- 2 straight Top 10 finishes (active streak)
- 2022/23 Superspeedway Track Stats (Avg. Fin. and Driver Rating rank among drivers with 1+ Superspeedway Track start, 61 drivers)
- 4 Races, Avg. Finish 6.75(4th), 80.24% of Laps ran in Top15, Avg. Driver Rating 103.13(2nd), Best 3rd, Worst 16th, Laps Completed 100%, Led 13.49% of laps he ran, 0 Wins, 0 Poles, 2 Top 3’s, 3 Top 5’s, 3 Top 10’s, 3 Top 15’s, 0 Finishes out of Top 20, 0 DNF’s, 1 Stage Win, 5.38 Stage Pts Per Stage
- Atlanta Statistics
- 2022 Atlanta Race
- Finished 16th, Started 16th, Led 3 laps (2.22%), Finished 4th in Stage 1 and 4th in Stage 2, ran 67 Laps in Top15 (49.63% of laps he ran), had 75.2 Driver Rating
- Notable Atlanta Statistics (Ranks are of drivers with 1+ start this year)
- 2 Races
- 9.5 Avg. Finish (Ranks 6th)
- Best Finish: 3rd, Worst: 16th
- Completed 100% of laps (% ranks T1st)
- 72.32% of Laps ran in Top15 (% ranks 9th)
- 95.1 Average Driver Rating (Ranks 7th)
- Led 7.75% of laps he’s run (% ranks 3rd)
- 0 Top 2’s
- 1 Top 3, 50.0% (% ranks T3rd)
- 1 Top 15, 50.0% (% ranks T15th)
- 0 finishes outside Top 20, 0.00% (% ranks T1st)
- 0 DNF’s, 0.00% (% ranks T1st)
- 0 Stage Wins
- 4 Stage Top 10’s, 100% (% ranks T1st)
- 6.75 Stage Pts Per Stage (Ranks 1st)
Christian Eckes is notable, like his ex-teammate above, because of his 2023 stats. At Las Vegas Eckes outperformed my expectations and ran well all night ending with a 6th place finish. That gives Eckes 2 Top 10’s on the year and a 4.5 Avg. Finish which is 3rd best this year behind only Kyle Busch and Zane Smith, as is his 112.65 Avg. Driver Rating. He has also ran 87.79% of his laps inside the Top 15 this year but only has 16 Stage Pts in the 4 stages. In the last 4 Superspeedway races he has a 6.75 Avg. Finish in those 4 races, good for 4th best, and his 103.13 Avg. Driver Rating is good for 2nd best behind only Ryan Preece in that span. In addition Eckes has 2 finishes in the Top 3 and has led a whopping 13.49% of the laps he’s ran. As if that isn’t enough he also has over 5 Stage Pts Per Stage in the 4 races. Last year at Atlanta Eckes led 3 laps and got 14 Stage Pts but ended up 16th at the end of the race leading to a 75.2 Driver Rating. This was Eckes’ 2nd race at Atlanta and was his worst of the 2 as in his first race he finished 3rd, ran 95% of his laps in the Top 15, and got 13 Stage Pts. He has been great here in stages though as his 6.75 Stage Pts Per Stage is the best of any active driver, and I see more stage success ahead for him. I think Eckes gets 10+ Stage Pts and if he stays out of trouble finishes in the Top 10, but I don’t see anything better than 5th.
4th in Points – Matt Crafton
| Category | Statistic | 2023 Rank | ªRank Thru 2 Races |
| Avg. Fin.¹ | 10.0 | T10th of 47 | T67th of 338 |
| Completed Laps%¹ | 100% | T1st of 47 | T1st of 338 |
| Laps in Top15%¹ | 95.31% | 1st of 46 | 17th of 337 |
| Avg. Driver Rating¹ | 92.3 | 9th of 46 | 56th of 337‡ |
| Wins | 0 | T3rd of 47 | T16th of 338 |
| Poles | 0 | T3rd of 47 | T15th of 338 |
| Top 2’s | 0 | T4th of 47 | T31st of 338 |
| Top 3’s | 0 | T6th of 47 | T45th of 338 |
| Top 5’s | 0 | T10th of 47 | T75th of 338 |
| Top 10’s | 1 | T6th of 47 | T26th of 338 |
| DNF’s¹ | 0 | T1st of 47 | T1st of 338 |
| Stage Wins | 0 | T5th of 47 | T21st of 299* |
| Stage T10s | 4 | T1st of 47 | T1st of 299* |
| Stage Pts | 27 | 1st of 47 | T8th of 299* |
| Playoff Pts² | 0 | T5th of 47 | T23rd of 299* |
ªSince Playoffs started in 2016
¹Ranks of drivers to start 43% of races thru 2 races
²Earned from races only
*Stage racing started in 2017
‡Max Driver Rating is 150.0
- Notable Streaks this/last year
- none
- 2022/23 Superspeedway Track Stats (Avg. Fin. and Driver Rating rank among drivers with 1+ Superspeedway Track start, 61 drivers)
- 4 Races, Avg. Finish 20.75(36th), 57.25% of Laps ran in Top15, Avg. Driver Rating 76.68(18th), Best 9th, Worst 27th, Laps Completed 98.07%, Led 0.98% of laps he ran, 0 Wins, 0 Poles, 0 Top 3’s, 0 Top 5’s, 1 Top 10, 1 Top 15, 3 Finishes out of Top 20, 1 DNF, 0 Stage Wins, 4.25 Stage Pts Per Stage
- Atlanta Statistics
- 2022 Atlanta Race
- Finished 25th, Started 3rd, Led 1 lap (0.74%), Finished 5th in Stage 1 and 6th in Stage 2, ran 96 Laps in Top15 (72.18% of laps he ran), had 84.3 Driver Rating
- Notable Atlanta Statistics (Ranks are of drivers with 1+ start this year)
- 21 Races
- 12.19 Avg. Finish (Ranks 11th)
- Best Finish: 1st, Worst: 30th
- Completed 96.3% of laps (% ranks 24th)
- 86.86% of Laps ran in Top15 (% ranks 3rd)
- 102.68 Average Driver Rating (Ranks 2nd)
- Led 7.08% of laps he’s run (% ranks 4th)
- 1 Win, 4.76% (% ranks 5th)
- 3 Top 3’s, 14.29% (% ranks T7th)
- 11 Top 10’s, 52.38% (% ranks 9th)
- 16 Top 15’s, 76.19% (% ranks 9th)
- 5 finishes outside Top 20, 23.81% (% ranks 18th)
- 1 DNF, 4.76% (% ranks 25th)
- 0 Stage Wins
- 11 Stage Top 10’s, 91.67% (% ranks 3rd)
- 4.58 Stage Pts Per Stage (Ranks 2nd)
Matt Crafton is notable due to his 4th place in the points standing thru 2 races. In Las Vegas Crafton ran a lot of the race in the Top 15, unfortunately a lot of that was around where he finished though, 11th. This finish did give Crafton a 10.0 Avg. Finish on the year at least, ranking 10th, and he has a 92.3 Avg. Driver Rating which is good for 9th best. The most impressive stats are his 95.31 Laps in Top15% and his 27 Stage Pts as both of these are the best of any driver this year. The Stage Pts may only get better heading to a drafting track this week as in the last 4 of these races Crafton has 4.25 Stage Pts Per Stage. Unfortunately for Crafton this is his only good stat in the 4 races as he only has 1 Top 15 finish, and his Avg. Finish is 20.75. In addition Crafton has only ran 57.25% of his laps in the Top 15 and has 3 finishes outside the Top 20. One of these was last year at Atlanta where despite running 72% of his laps inside the Top 15 he ended up finishing 25th. This is not typical of Crafton however, but this is a different Atlanta than most of his stats account for so I am not sure how much these stats matter. Crafton does have a 12.19 Avg. Finish though and his 102.68 Avg. Driver Rating ranks 2nd among active drivers. Based on Crafton’s struggles at drafting tracks this year I don’t see Atlanta being great for him. I see Crafton maybe getting a Top 15, but if he does I don’t see it being better than 11th.
5th in Points – Ben Rhodes
| Category | Statistic | 2023 Rank | ªRank Thru 2 Races |
| Avg. Fin.¹ | 7.0 | T6th of 47 | T33rd of 338 |
| Completed Laps%¹ | 100% | T1st of 47 | T1st of 338 |
| Laps in Top15%¹ | 89.2% | 4th of 46 | 30th of 337 |
| Avg. Driver Rating¹ | 100.8 | 5th of 46 | 31st of 337‡ |
| Wins | 0 | T3rd of 47 | T16th of 338 |
| Poles | 0 | T3rd of 47 | T15th of 338 |
| Top 2’s | 0 | T4th of 47 | T31st of 338 |
| Top 3’s | 1 | T2nd of 47 | T5th of 338 |
| Top 5’s | 1 | T2nd of 47 | T7th of 338 |
| Top 10’s | 1 | T6th of 47 | T26th of 338 |
| DNF’s¹ | 0 | T1st of 47 | T1st of 338 |
| Stage Wins | 0 | T5th of 47 | T21st of 299* |
| Stage T10s | 3 | T5th of 47 | T16th of 299* |
| Stage Pts | 17 | T5th of 47 | T30th of 299* |
| Playoff Pts² | 0 | T5th of 47 | T23rd of 299* |
ªSince Playoffs started in 2016
¹Ranks of drivers to start 43% of races thru 2 races
²Earned from races only
*Stage racing started in 2017
‡Max Driver Rating is 150.0
- Notable Streaks this/last year
- none
- 2022/23 Superspeedway Track Stats (Avg. Fin. and Driver Rating rank among drivers with 1+ Superspeedway Track start, 61 drivers)
- 4 Races, Avg. Finish 4.25(1st), 84.58% of Laps ran in Top15, Avg. Driver Rating 97.65(4th), Best 2nd, Worst 11th, Laps Completed 100%, Led 4.1% of laps he ran, 0 Wins, 0 Poles, 3 Top 3’s, 3 Top 5’s, 3 Top 10’s, 4 Top 15’s, 0 Finishes out of Top 20, 0 DNF’s, 0 Stage Wins, 3.0 Stage Pts Per Stage
- Atlanta Statistics
- 2022 Atlanta Race
- Finished 2nd, Started 15th, Led 9 laps (6.67%), got 0 Stage T10’s, ran 114 Laps in Top15 (84.44% of laps he ran), had 99.4 Driver Rating
- Notable Atlanta Statistics (Ranks are of drivers with 1+ start this year)
- 7 Races
- 6.57 Avg. Finish (Ranks 3rd)
- Best Finish: 2nd, Worst: 16th
- Completed 99.89% of laps (% ranks 9th)
- 82.68% of Laps ran in Top15 (% ranks 6th)
- 98.74 Average Driver Rating (Ranks 6th)
- Led 3.14% of laps he’s run (% ranks T8th)
- 0 Wins
- 1 Top 2, 14.29% (% ranks T4th)
- 4 Top 5’s, 57.14% (% ranks 4th)
- 6 Top 10’s, 85.71% (% ranks 3rd)
- 0 finishes outside Top 20, 0.00% (% ranks T1st)
- 0 DNF’s, 0.00% (% ranks T1st)
- 0 Stage Wins
- 6 Stage Top 10’s, 50.0% (% ranks T8th)
- 2.92 Stage Pts Per Stage (Ranks 6th)
Ben Rhodes is notable because of how well his 4 Superspeedway starts between this year and last year have been. Two weeks ago at Las Vegas Rhodes ran good and ended up with a 3rd place finish. This was Rhodes’ first Top 10 of the year and leaves him with the T6th best Avg. Finish at 7.0. Rhodes also has the 5th best Avg. Driver Rating (100.8) and 4th best Laps in Top15% (89.2%). This bodes well for Rhodes as the Truck Series is heading to his best type of track statistically between this year and last. In the last 4 Superspeedway races Rhodes has the best Avg. Finish at 4.25, the 4th best Avg. Driver Rating at 97.65, and has three 2nd place finishes. In addition to these impressive stats he also has 3 Stage Pts Per Stage and has ran 85% of his laps inside the Top 15. One of these 2nd’s was at Atlanta last year where Rhodes ran 85% of his laps inside the Top 15 en route to a 99.4 Driver Rating and a 2nd place finish. This race was pretty average with how Rhodes has run here in the past even though this was the first race at Atlanta as a drafting track. In 7 races here Rhodes has a 6.57 Avg. Finish with over half of his races finishing in the Top 5 and only finishing outside the Top 10 once. In all his Avg. Driver Rating is an impressive 98.74 and he gets 2.92 Stage Pts Per Stage. Based on how Rhodes has been doing on drafting tracks and his impressive stats at Atlanta I see him challenging all day long ending with a Top 5 finish.
11th in Points – Corey Heim
| Category | Statistic | 2023 Rank | ªRank Thru 2 Races |
| Avg. Fin.¹ | 6.0 | 5th of 47 | T28th of 338 |
| Completed Laps%¹ | 100% | T1st of 47 | T1st of 338 |
| Laps in Top15%¹ | 77.0% | 9th of 46 | 63rd of 337 |
| Avg. Driver Rating¹ | 97.7 | 6th of 46 | 36th of 337‡ |
| Wins | 0 | T3rd of 47 | T16th of 338 |
| Poles | 0 | T3rd of 47 | T15th of 338 |
| Top 2’s | 0 | T4th of 47 | T31st of 338 |
| Top 3’s | 0 | T6th of 47 | T45th of 338 |
| Top 5’s | 1 | T2nd of 47 | T7th of 338 |
| Top 10’s | 2 | T1st of 47 | T1st of 338 |
| DNF’s¹ | 0 | T1st of 47 | T1st of 338 |
| Stage Wins | 0 | T5th of 47 | T21st of 299* |
| Stage T10s | 0 | T18th of 47 | T137th of 299* |
| Stage Pts | 0 | T16th of 47 | T115th of 299* |
| Playoff Pts² | 0 | T5th of 47 | T23rd of 299* |
ªSince Playoffs started in 2016
¹Ranks of drivers to start 43% of races thru 2 races
²Earned from races only
*Stage racing started in 2017
‡Max Driver Rating is 150.0
- Notable Streaks this/last year
- 4 straight Top 10 finishes (active streak)
- 2022/23 Superspeedway Track Stats (Avg. Fin. and Driver Rating rank among drivers with 1+ Superspeedway Track start, 61 drivers)
- 4 Races, Avg. Finish 16.75(24th), 59.15% of Laps ran in Top15, Avg. Driver Rating 85.9(11th), Best 1st, Worst 32nd, Laps Completed 96.14%, Led 5.51% of laps he ran, 1 Win, 0 Poles, 1 Top 3, 1 Top 5, 2 Top 10’s, 2 Top 15’s, 2 Finishes out of Top 20, 2 DNF’s, 0 Stage Wins, 1.63 Stage Pts Per Stage
- Atlanta Statistics
- 2022 Atlanta Race
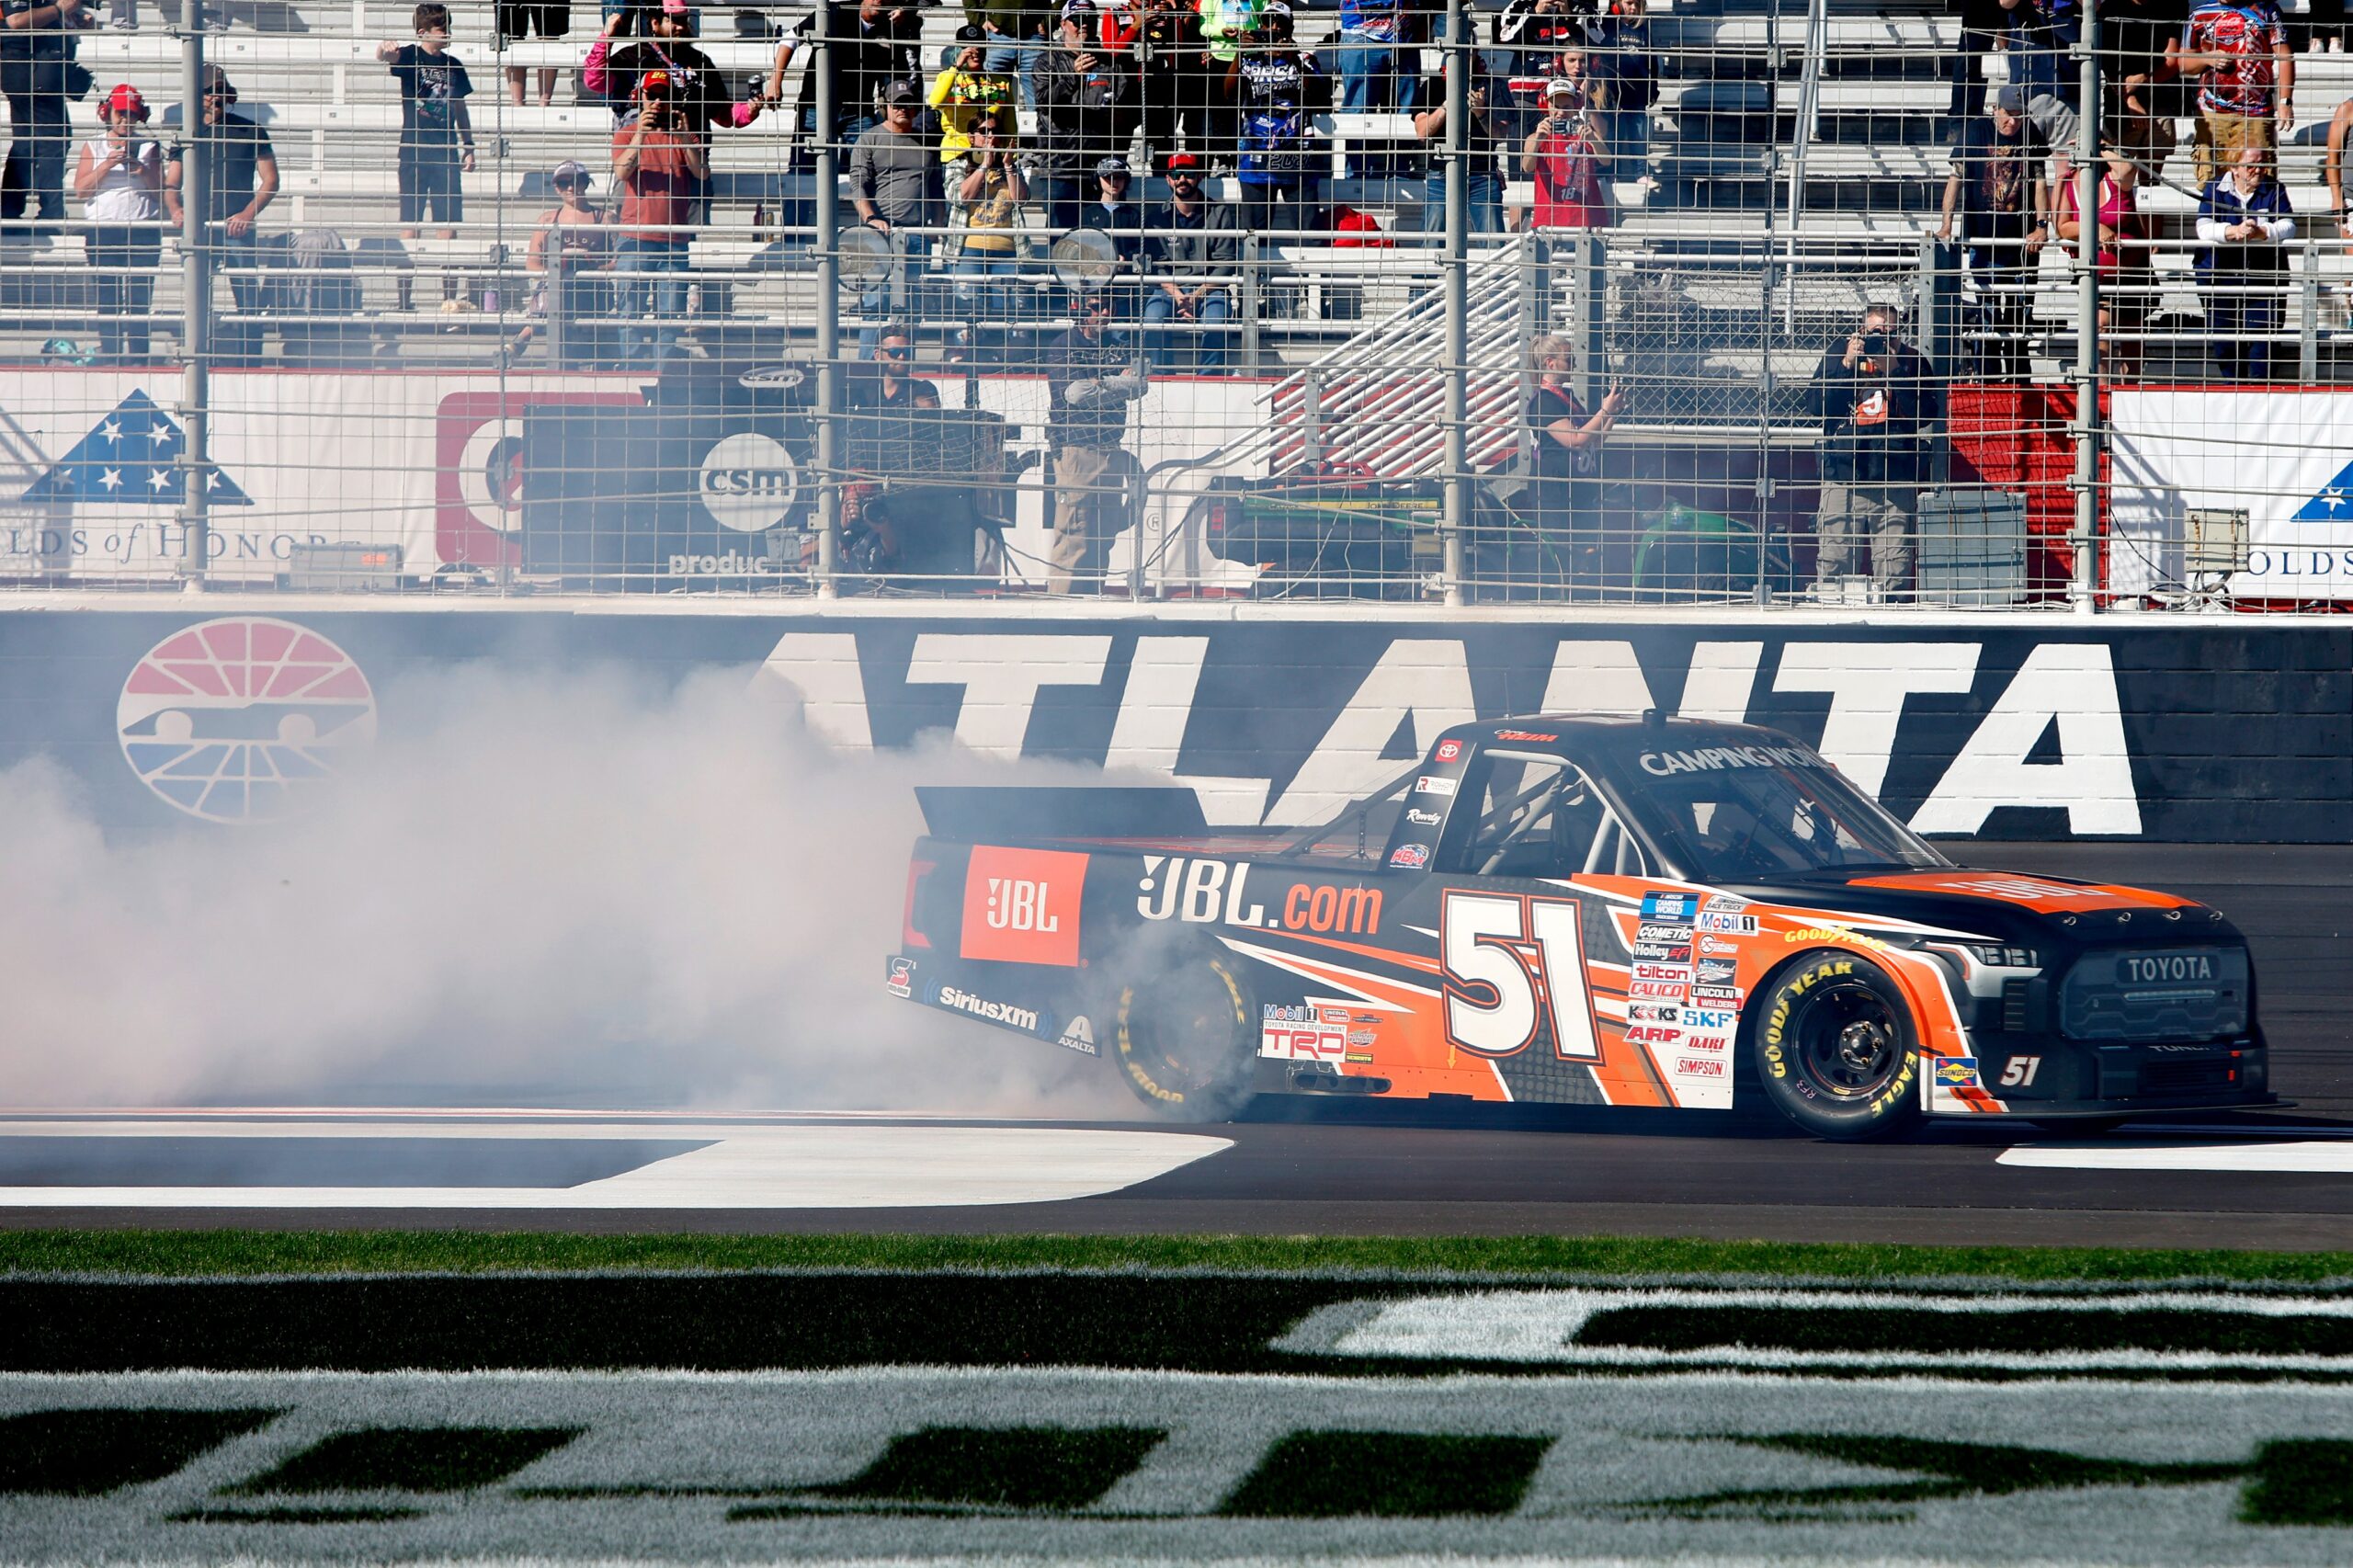
- Finished 1st, Started 19th, Led 22 laps (16.3%), got 0 Stage T10’s, ran 94 Laps in Top15 (69.63% of laps he ran), had 99.0 Driver Rating
- Notable Atlanta Statistics (Ranks are of drivers with 1+ start this year)
- 1 Race
- 1.0 Avg. Finish (Ranks 1st)
- Best Finish: 1st, Worst: 1st
- Completed 100% of laps (% ranks T1st)
- 69.63% of Laps ran in Top15 (% ranks 10th)
- 99.0 Average Driver Rating (Ranks 5th)
- Led 16.3% of laps he’s run (% ranks 2nd)
- 1 Win, 100% (% ranks 1st)
- 0 finishes outside Top 20, 0.00% (% ranks T1st)
- 0 DNF’s, 0.00% (% ranks T1st)
- 0 Stage Wins
- 0 Stage Top 10’s
Corey Heim is notable because of how well his 1 career start here at Atlanta went. In Las Vegas Heim got his 2nd Top 10 of the season extending his Top 10 streak to 4 which ties Zane Smith for longest active Top 10 streak. Through the first 2 races Heim has a 6.0 Avg. Finish and a 97.7 Avg. Driver Rating, ranking 5th and 6th on the season respectively. One glaring weakness for Heim this year is his Stage Pts, or lack there of, as he hasn’t gotten a single Stage Pt this year. This could, but I wouldn’t necessarily guarantee, change this weekend at Atlanta as in the last 4 Superspeedway races Heim has 1.63 Stage Pts Per Stage. In those 4 races Heim has 1 win (Atlanta last year) but not much else. In total Heim only has 2 Top 10’s, an Avg Finish of 16.75 that is good for 24th best, and ran 59.15% of his laps in the Top 15. The good news is that the 2 races outside the Top 10 were DNF’s, so if he can stay for the finish then he has gotten Top 10’s. As I mentioned above last year at Atlanta Heim won after leading 22 laps and running 70% of his laps in the Top 15. Unfortunately for Heim he got 0 Stage Pts though, and he only had the 8th best Driver Rating at 99.0. This is Heim’s only race here so obviously his stats are quite good and rank well in the Atlanta ranks above. This year I don’t see Heim getting the win like he did last year, but I believe he will still run decent most the race and if he finishes the race he will end up in the Top 10.
12th in Points – Tyler Ankrum
| Category | Statistic | 2023 Rank | ªRank Thru 2 Races |
| Avg. Fin.¹ | 11.0 | T13th of 47 | T79th of 338 |
| Completed Laps%¹ | 99.53% | T21st of 47 | T136th of 338 |
| Laps in Top15%¹ | 39.91% | 21st of 46 | 167th of 337 |
| Avg. Driver Rating¹ | 80.35 | 16th of 46 | 107th of 337‡ |
| Wins | 0 | T3rd of 47 | T16th of 338 |
| Poles | 0 | T3rd of 47 | T15th of 338 |
| Top 2’s | 0 | T4th of 47 | T31st of 338 |
| Top 3’s | 0 | T6th of 47 | T45th of 338 |
| Top 5’s | 0 | T10th of 47 | T75th of 338 |
| Top 10’s | 1 | T6th of 47 | T26th of 338 |
| DNF’s¹ | 0 | T1st of 47 | T1st of 338 |
| Stage Wins | 1 | T1st of 47 | T9th of 299* |
| Stage T10s | 1 | T13th of 47 | T88th of 299* |
| Stage Pts | 10 | T10th of 47 | T51st of 299* |
| Playoff Pts² | 1 | T2nd of 47 | T16th of 299* |
ªSince Playoffs started in 2016
¹Ranks of drivers to start 43% of races thru 2 races
²Earned from races only
*Stage racing started in 2017
‡Max Driver Rating is 150.0
- Notable Streaks this/last year
- none
- 2022/23 Superspeedway Track Stats (Avg. Fin. and Driver Rating rank among drivers with 1+ Superspeedway Track start, 61 drivers)
- 4 Races, Avg. Finish 14.0(T15th), 85.54% of Laps ran in Top15, Avg. Driver Rating 91.3(5th), Best 7th, Worst 28th, Laps Completed 98.31%, Led 4.66% of laps he ran, 0 Wins, 0 Poles, 0 Top 3’s, 0 Top 5’s, 2 Top 10’s, 3 Top 15’s, 1 Finish out of Top 20, 1 DNF, 1 Stage Win, 3.5 Stage Pts Per Stage
- Atlanta Statistics
- 2022 Atlanta Race
- Finished 11th, Started 10th, Led 0 laps, Finished 10th in Stage 1 and 5th in Stage 2, ran 122 Laps in Top15 (90.37% of laps he ran), had 94.0 Driver Rating
- Notable Atlanta Statistics (Ranks are of drivers with 1+ start this year)
- 3 Races
- 14.67 Avg. Finish (Ranks 16th)
- Best Finish: 11th, Worst: 18th
- Completed 99.75% of laps (% ranks T10th)
- 48.0% of Laps ran in Top15 (% ranks 18th)
- 80.3 Average Driver Rating (Ranks 16th)
- Led 0.00% of laps he’s run
- 0 Top 10’s
- 2 Top 15’s, 66.67% (% ranks T11th)
- 0 finishes outside Top 20, 0.00% (% ranks T1st)
- 0 DNF’s, 0.00% (% ranks T1st)
- 0 Stage Wins
- 2 Stage Top 10’s, 33.33% (% ranks T13th)
Tyler Ankrum is notable due to how well his stats are in the last 4 Superspeedway races. In Las Vegas Ankrum spent 80% of the race outside the Top 15, but when it counted he was 15th. When you look at Ankrum’s stats thru 2 races this year they do not impress in the least. He has an 11.0 Avg. Finish, an 80.35 Avg. Driver Rating, and has only ran 40% of his laps in the Top 15. All three categories are 13th or worse in the 2023 Ranks above. One piece of good news is Ankrum has 1 Stage Win, but bad news is that is his only Stage T10 as well. This may change when you look at his 2022/23 Superspeedway stats as he has gotten 3.5 Stage Pts Per Stage in the 4 races. Ankrum has run well in the 4 races as he has been in the Top 15 for 85.84% of his laps and has the 5th best Avg. Driver Rating at 91.3. Unfortunately these good runs haven’t produced good finishes as his best finish is 7th and his Avg. Finish is 14.0 with only 2 Top 10’s. One of those Top 10’s was not at Atlanta last year where he finished 11th after being in the Top 15 for 90% of the race. This was Ankrum’s best finish here in 3 starts though and his Avg. Finish is 14.67. More bad news is that he has ran less than 50% of his laps here in the Top 15. The good news is that 2/3rd’s of these races were on the old configuration and I see Ankrum fairing better Saturday. I think Ankrum runs Top 15 most the day but gets caught up in a wreck that relegates him to a finish outside the Top 20.
15th in Points – Stewart Friesen
| Category | Statistic | 2023 Rank | ªRank Thru 2 Races |
| Avg. Fin.¹ | 21.0 | T24th of 47 | T203rd of 338 |
| Completed Laps%¹ | 97.18% | 30th of 47 | 190th of 338 |
| Laps in Top15%¹ | 36.15% | 23rd of 46 | 174th of 337 |
| Avg. Driver Rating¹ | 58.55 | 24th of 46 | 193rd of 337‡ |
| Wins | 0 | T3rd of 47 | T16th of 338 |
| Poles | 0 | T3rd of 47 | T15th of 338 |
| Top 2’s | 0 | T4th of 47 | T31st of 338 |
| Top 3’s | 0 | T6th of 47 | T45th of 338 |
| Top 5’s | 0 | T10th of 47 | T75th of 338 |
| Top 10’s | 0 | T16th of 47 | T136th of 338 |
| DNF’s¹ | 0 | T1st of 47 | T1st of 338 |
| Stage Wins | 0 | T5th of 47 | T21st of 299* |
| Stage T10s | 0 | T18th of 47 | T137th of 299* |
| Stage Pts | 0 | T16th of 47 | T115th of 299* |
| Playoff Pts² | 0 | T5th of 47 | T23rd of 299* |
ªSince Playoffs started in 2016
¹Ranks of drivers to start 43% of races thru 2 races
²Earned from races only
*Stage racing started in 2017
‡Max Driver Rating is 150.0
- Notable Streaks this/last year
- none
- 2022/23 Superspeedway Track Stats (Avg. Fin. and Driver Rating rank among drivers with 1+ Superspeedway Track start, 61 drivers)
- 4 Races, Avg. Finish 17.5(27th), 59.76% of Laps ran in Top15, Avg. Driver Rating 78.58(16th), Best 6th, Worst 28th, Laps Completed 98.8%, Led 12.93% of laps he ran, 0 Wins, 0 Poles, 0 Top 3’s, 0 Top 5’s, 1 Top 10, 1 Top 15, 1 Finish out of Top 20, 0 DNF’s, 1 Stage Win, 3.25 Stage Pts Per Stage
- Atlanta Statistics
- 2022 Atlanta Race
- Finished 6th, Started 2nd, Led 49 laps (36.3%), Finished 1st in Stage 1, ran 123 Laps in Top15 (91.11% of laps he ran), had 123.8 Driver Rating
- Notable Atlanta Statistics (Ranks are of drivers with 1+ start this year)
- 6 Races
- 11.5 Avg. Finish (Ranks 9th)
- Best Finish: 6th, Worst: 19th
- Completed 100% of laps (% ranks T1st)
- 59.25% of Laps ran in Top15 (% ranks 16th)
- 87.03 Average Driver Rating (Ranks 11th)
- Led 6.16% of laps he’s run (% ranks 6th)
- 0 Top 5’s
- 4 Top 10’s, 66.67% (% ranks T6th)
- 4 Top 15’s, 66.67% (% ranks T11th)
- 0 finishes outside Top 20, 0.00% (% ranks T1st)
- 0 DNF’s, 0.00% (% ranks T1st)
- 1 Stage Win, 8.33% (% ranks 3rd)
- 2.42 Stage Pts Per Stage (Ranks 7th)
Stewart Friesen is notable because of how well he did in the Truck race here last year. In Las Vegas Friesen was less than stellar as he ran less than 40% of his laps in the Top 15 and finished 14th. While this was only the 2nd Truck race of 2023 his stats are still hard to look at. His best finish is 14th, his Avg. Finish is 21.0, he’s only been in the Top 15 for 36.15% of his laps, and his Avg. Driver Rating is a meek 58.55. All of these are 23rd or 24th in the 2023 Ranks above, but what is most concerning is Friesen’s 0 Stage Pts. This could change this weekend though as in the four 2022/23 Superspeedway races Friesen has 3.25 Stage Pts Per Stage. Unfortunately his Avg. Finish is 17.5 in those 4 races with only 1 Top 15. Another reason for concern is that only 60% of his laps in those races were run in the Top 15 and his Avg. Driver Rating is 78.58. Now to good news, last year at Atlanta Friesen led 36.3% of the laps en route to a 6th place finish. He also won Stage 1 last year here and was in the Top 15 for 91.11% of his laps which led to the best Driver Rating in the race at 123.8. Overall in 6 races here Friesen has an 11.5 Avg. Finish and 4 Top 10’s, but his best finish is only 6th and he’s only ran 59.25% of his laps in the Top 15 while completing every lap. Based on overall stats Friesen will struggle this weekend, but I think this will be like Atlanta last year and Friesen runs near the front ending up with a Top 5.