
1st in Points – Christian Eckes
| Category | Statistic | 2023 Rank | ªRank Thru 3 Races |
| Avg. Fin.¹ | 3.33 | 1st of 30 | 5th of 242 |
| Completed Laps%¹ | 100% | T1st of 30 | T1st of 242 |
| Laps in Top15%¹ | 83.43% | 5th of 30 | 40th of 242 |
| Avg. Driver Rating¹ | 111.43 | 1st of 30 | 11th of 242‡ |
| Wins | 1 | T1st of 53 | T3rd of 391 |
| Poles | 0 | T3rd of 53 | T18th of 391 |
| Top 2’s | 1 | T2nd of 53 | T8th of 391 |
| Top 3’s | 2 | T1st of 53 | T2nd of 391 |
| Top 5’s | 2 | T1st of 53 | T2nd of 391 |
| Top 10’s | 3 | 1st of 53 | T1st of 391 |
| DNF’s¹ | 0 | T1st of 30 | T1st of 242 |
| Stage Wins | 2 | 1st of 53 | T5th of 342* |
| Stage T10s | 3 | T7th of 53 | T51st of 342* |
| Stage Pts | 26 | 6th of 53 | T26th of 342* |
| Playoff Pts² | 7 | 1st of 53 | T3rd of 342* |
ªSince Playoffs started in 2016
¹Ranks of drivers to start 43% of races thru 3 races
²Earned from races only, does not reflect penalties
*Stage racing started in 2017
‡Max Driver Rating is 150.0
- Notable Streaks this/last year
- 3 straight Top 10 finishes (active streak)
- 2022 Road Course Stats (Avg. Fin. and Driver Rating rank among drivers with 1+ Road Course start, 51 drivers)
- 3 Races, Avg. Finish 15.33(16th), 93.53% of Laps ran in Top15, Avg. Driver Rating 82.4(13th), Best 5th, Worst 35th, Laps Completed 73.94%, Led 0.00% of laps he ran, 0 Wins, 0 Poles, 0 Top 3’s, 1 Top 5, 2 Top 10’s, 2 Top 15’s, 1 Finish out of Top 20, 1 DNF, 0 Stage Wins, 2.5 Stage Pts Per Stage
- COTA Statistics
- 2022 COTA Race
- Finished 6th, Started 8th, Led 0 laps, Finished 8th in Stage 1, ran 38 Laps in Top15 (82.61% of laps he ran), had 92.7 Driver Rating
- Notable COTA Statistics (Ranks are of drivers with 1+ start this year)
- 2 Races
- 20.5 Avg. Finish (Ranks 15th)
- Best Finish: 6th, Worst: 35th
- Completed 94.25% of laps (% ranks 21st)
- 54.88% of Laps ran in Top15 (% ranks 13th)
- 67.1 Average Driver Rating (Ranks 16th)
- Led 0.00% of laps he’s run
- 0 Top 5’s
- 1 Top 10, 50.0% (% ranks T7th)
- 1 Top 15, 50.0% (% ranks T11th)
- 1 finish outside Top 20, 50.0% (% ranks T13th)
- 1 DNF, 50.0% (% ranks T23rd)
- 0 Stage Wins
- 1 Stage Top 10, 25.0% (% ranks T13th)
Christian Eckes is notable because of his stats on the young 2023 season. Last week Eckes used some impressive moves to stay in the lead on the last lap to win his first race of the season. In the 3 races this year Eckes has 2 Top 5’s and 3 Top 10’s, the only driver to have a Top 10 in all 3 races. This gives Eckes the best Avg. Finish and Avg. Driver Rating in the 2023 Ranks above at 3.33 and 111.43 respectively. As a matter of fact most of Eckes’ 2023 Ranks above are 1st or T1st, but his 3 Stage T10’s and 26 Stage Pts aren’t among them. The race this weekend is a Road Course though. In the 3 Road Course races last year Eckes had 1 Top 5 and 2 Top 10’s but also an Avg. Finish of 15.33. This is a little askew though as he also had 1 DNF that dramatically dropped his Avg. Finish, but he also led 0 laps and had an 82.4 Avg. Driver Rating. At COTA last year Eckes ran 82.61% of his laps in the Top 15 and finished 6th in the race with a 92.7 Driver Rating. This was only his 2nd start here but last year went a lot better than his first race. His first race here ended in a 35th place DNF finish which makes his Avg. Finish here 20.5. In all based on the stats the only thing that can stop Eckes from getting a Top 10 this weekend is a DNF and with the run he’s been on I don’t see that happening. I think Eckes falls short of another Top 5 but as long as he finishes then he will get a Top 10.
2nd in Points – Matt Crafton
| Category | Statistic | 2023 Rank | ªRank Thru 3 Races |
| Avg. Fin.¹ | 9.67 | 5th of 30 | T36th of 242 |
| Completed Laps%¹ | 100% | T1st of 30 | T1st of 242 |
| Laps in Top15%¹ | 88.57% | 3rd of 30 | 20th of 242 |
| Avg. Driver Rating¹ | 98.13 | 5th of 30 | 30th of 242‡ |
| Wins | 0 | T4th of 53 | T23rd of 391 |
| Poles | 0 | T3rd of 53 | T18th of 391 |
| Top 2’s | 0 | T6th of 53 | T42nd of 391 |
| Top 3’s | 0 | T8th of 53 | T59th of 391 |
| Top 5’s | 0 | T13th of 53 | T98th of 391 |
| Top 10’s | 2 | T2nd of 53 | T15th of 391 |
| DNF’s¹ | 0 | T1st of 30 | T1st of 242 |
| Stage Wins | 1 | T2nd of 53 | T11th of 342* |
| Stage T10s | 6 | T1st of 53 | T1st of 342* |
| Stage Pts | 44 | 1st of 53 | 3rd of 342* |
| Playoff Pts² | 1 | T3rd of 53 | T19th of 342* |
ªSince Playoffs started in 2016
¹Ranks of drivers to start 43% of races thru 3 races
²Earned from races only, does not reflect penalties
*Stage racing started in 2017
‡Max Driver Rating is 150.0
- Notable Streaks this/last year
- none
- 2022 Road Course Stats (Avg. Fin. and Driver Rating rank among drivers with 1+ Road Course start, 51 drivers)
- 3 Races, Avg. Finish 21.67(30th), 49.7% of Laps ran in Top15, Avg. Driver Rating 62.97(25th), Best 13th, Worst 34th, Laps Completed 88.83%, Led 0.00% of laps he ran, 0 Wins, 0 Poles, 0 Top 3’s, 0 Top 5’s, 0 Top 10’s, 1 Top 15, 1 Finish out of Top 20, 1 DNF, 0 Stage Wins, 0.00 Stage Pts Per Stage
- COTA Statistics
- 2022 COTA Race
- Finished 13th, Started 20th, Led 0 laps, got 0 Stage T10’s, ran 21 Laps in Top15 (45.65% of laps he ran), had 68.7 Driver Rating
- Notable COTA Statistics (Ranks are of drivers with 1+ start this year)
- 2 Races
- 14.0 Avg. Finish (Ranks 10th)
- Best Finish: 13th, Worst: 15th
- Completed 100% of laps (% ranks T1st)
- 63.22% of Laps ran in Top15 (% ranks T10th)
- 79.2 Average Driver Rating (Ranks 11th)
- Led 1.15% of laps he’s run (% ranks T6th)
- 0 Top 10’s
- 2 Top 15’s, 100% (% ranks T1st)
- 0 finishes outside Top 20, 0.00% (% ranks T1st)
- 0 DNF’s, 0.00% (% ranks T1st)
- 0 Stage Wins
- 4.0 Stage Pts Per Stage (Ranks 7th)
Matt Crafton is notable because of his point standings position after 3 races, 2nd. Last week Crafton led a good chunk of the race and even won Stage 2 before falling back to finish 9th at the end of the race. This tied Crafton’s best finish of the year so far and leaves him with a 9.67 Avg. Finish, so how does he sit 2nd in points? It’s because of his 6 Stage T10’s and 44 Stage Pts which both rank 1st in the 2023 Ranks above and 44 Stage Pts are actually the 3rd most thru 3 races since stage racing started. That may change this weekend at COTA though as Crafton did not perform well on Road Courses last year. In the 3 races Crafton accumulated just 1 Top 15 with an Avg. Finish of 21.67 (30th best) and a 62.97 Avg. Driver Rating (25th best). Even worse is the fact that he ran less than half his laps in the Top 15 and he didn’t even get a single Stage Pt. His best finish in the 3 races was 13th though which came here at COTA. In that race Crafton ran 45% of the laps in the Top 15 and ended with a subpar 68.7 Driver Rating. This is about right for Crafton here as in his 2 starts he has finishes of 13th and 15th with an Avg. Driver Rating of 79.2 that ranks 11th best among active drivers. So, with all that said the stats say this weekend will be a struggle for Crafton, and I have to agree. I think Crafton doesn’t run Top 15 much and will finish outside of or just inside the Top 15, but definitely out of the Top 10.
4th in Points – Ben Rhodes
| Category | Statistic | 2023 Rank | ªRank Thru 3 Races |
| Avg. Fin.¹ | 6.33 | 2nd of 30 | T15th of 242 |
| Completed Laps%¹ | 100% | T1st of 30 | T1st of 242 |
| Laps in Top15%¹ | 92.86% | 1st of 30 | 11th of 242 |
| Avg. Driver Rating¹ | 103.07 | 3rd of 30 | 17th of 242‡ |
| Wins | 0 | T4th of 53 | T23rd of 391 |
| Poles | 0 | T3rd of 53 | T18th of 391 |
| Top 2’s | 0 | T6th of 53 | T42nd of 391 |
| Top 3’s | 1 | T3rd of 53 | T14th of 391 |
| Top 5’s | 2 | T1st of 53 | T2nd of 391 |
| Top 10’s | 2 | T2nd of 53 | T15th of 391 |
| DNF’s¹ | 0 | T1st of 30 | T1st of 242 |
| Stage Wins | 0 | T6th of 53 | T28th of 342* |
| Stage T10s | 5 | 4th of 53 | T8th of 342* |
| Stage Pts | 27 | 5th of 53 | T24th of 342* |
| Playoff Pts² | 0 | T6th of 53 | T27th of 342* |
ªSince Playoffs started in 2016
¹Ranks of drivers to start 43% of races thru 3 races
²Earned from races only, does not reflect penalties
*Stage racing started in 2017
‡Max Driver Rating is 150.0
- Notable Streaks this/last year
- 2 straight Top 5 finishes (active streak)
- 2022 Road Course Stats (Avg. Fin. and Driver Rating rank among drivers with 1+ Road Course start, 51 drivers)
- 3 Races, Avg. Finish 15.0(T14th), 55.08% of Laps ran in Top15, Avg. Driver Rating 88.17(11th), Best 4th, Worst 23rd, Laps Completed 99.47%, Led 3.21% of laps he ran, 0 Wins, 0 Poles, 0 Top 3’s, 1 Top 5, 1 Top 10, 1 Top 15, 1 Finish out of Top 20, 0 DNF’s, 1 Stage Win, 4.5 Stage Pts Per Stage
- COTA Statistics
- 2022 COTA Race
- Finished 4th, Started 13th, Led 0 laps, Finished 3rd in Stage 1 and 2nd in Stage 2, ran 38 Laps in Top15 (82.61% of laps he ran), had 105.8 Driver Rating
- Notable COTA Statistics (Ranks are of drivers with 1+ start this year)
- 2 Races
- 7.0 Avg. Finish (Ranks T4th)
- Best Finish: 4th, Worst: 10th
- Completed 100% of laps (% ranks T1st)
- 86.21% of Laps ran in Top15 (% ranks 2nd)
- 101.15 Average Driver Rating (Ranks 4th)
- Led 3.45% of laps he’s run (% ranks 5th)
- 0 Top 3’s
- 1 Top 5, 50.0% (% ranks T2nd)
- 2 Top 10’s, 100% (% ranks T1st)
- 0 finishes outside Top 20, 100% (% ranks T1st)
- 0 DNF’s, 100% (% ranks T1st)
- 1 Stage Win, 25.0% (% ranks 2nd)
- 4 Stage Top 10’s, 100% (% ranks T1st)
- 8.25 Stage Pts Per Stage (Ranks 1st)
Ben Rhodes is notable because of his good 2023 stats so far this year. In Atlanta Rhodes was going for the win before hitting the wall and ending up 5th, still this was his 2nd straight Top 5 finish. In addition to the 2 Top 5’s this year he has an 11th place finish which gives him a 6.33 Avg. Finish, 2nd in the 2023 Ranks above, and he’s ran 92.86% of his laps in the Top 15, 1st in the 2023 Ranks above. To go with these impressive stats Rhodes also has a 103.07 Avg. Driver Rating (3rd best) and has gotten a Stage T10 in every stage but 1. The stage success may continue this weekend as last year in the 3 Road Course races Rhodes had 4.5 Stage Pts Per Stage. However, other success may not be as prevalent since his Avg. Finish was only 15.0 with 1 Top 15 and he only ran 55% of his laps in the Top 15. There is good news though, his 1 Top 15 was a 4th here at COTA where he also got 15 Stage Pts. To further the good news Rhodes had a 105.8 Driver Rating this race and ran over 80% of his laps in the Top 15. This has been typical of Rhodes here at COTA as in his 2 starts he has a 7.0 Avg. Finish, a 101.15 Avg. Driver Rating, and has ran 86.21% of his laps in the Top 15 with 8.25 Stage Pts Per Stage. With all this said Rhodes stats seem to say he will be pretty good this weekend, thus I see him running up front, getting Stage Pts, and finishing either just inside or just outside the Top 5.
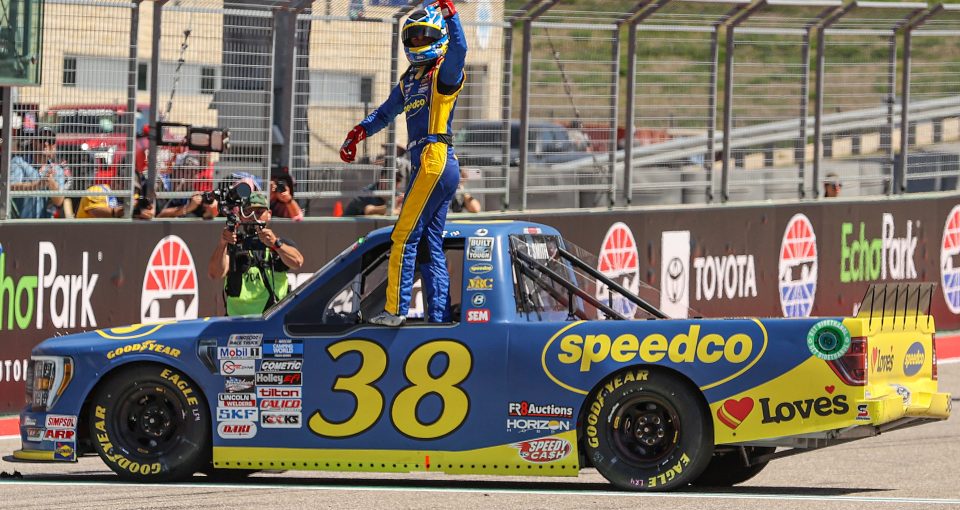
5th in Points – Zane Smith
| Category | Statistic | 2023 Rank | ªRank Thru 3 Races |
| Avg. Fin.¹ | 7.67 | 4th of 30 | T25th of 242 |
| Completed Laps%¹ | 100% | T1st of 30 | T1st of 242 |
| Laps in Top15%¹ | 82.57% | 6th of 30 | 43rd of 242 |
| Avg. Driver Rating¹ | 109.4 | 2nd of 30 | 13th of 242‡ |
| Wins | 1 | T1st of 53 | T3rd of 391 |
| Poles | 0 | T3rd of 53 | T18th of 391 |
| Top 2’s | 2 | 1st of 53 | T1st of 391 |
| Top 3’s | 2 | T1st of 53 | T2nd of 391 |
| Top 5’s | 2 | T1st of 53 | T2nd of 391 |
| Top 10’s | 2 | T2nd of 53 | T15th of 391 |
| DNF’s¹ | 0 | T1st of 30 | T1st of 242 |
| Stage Wins | 1 | T2nd of 53 | T11th of 342* |
| Stage T10s | 3 | T7th of 53 | T51st of 342* |
| Stage Pts | 24 | 7th of 53 | T33rd of 342* |
| Playoff Pts² | 6 | 2nd of 53 | T5th of 342* |
ªSince Playoffs started in 2016
¹Ranks of drivers to start 43% of races thru 3 races
²Earned from races only, does not reflect penalties
*Stage racing started in 2017
‡Max Driver Rating is 150.0
- Notable Streaks this/last year
- 2 straight Top 2 finishes
- 2022 Road Course Stats (Avg. Fin. and Driver Rating rank among drivers with 1+ Road Course start, 51 drivers)
- 3 Races, Avg. Finish 1.67(1st), 90.96% of Laps ran in Top15, Avg. Driver Rating 116.93(4th), Best 1st, Worst 2nd, Laps Completed 100%, Led 10.11% of laps he ran, 1 Win, 0 Poles, 3 Top 3’s, 3 Top 5’s, 3 Top 10’s, 3 Top 15’s, 0 Finishes out of Top 20, 0 DNF’s, 3 Stage Wins, 7.0 Stage Pts Per Stage
- COTA Statistics
- 2022 COTA Race
- Finished 1st, Started 2nd, Led 11 laps (23.91%), Finished 1st in Stage 1 and 1st in Stage 2, ran 41 Laps in Top15 (89.13% of laps he ran), had 133.2 Driver Rating
- Notable COTA Statistics (Ranks are of drivers with 1+ start this year)
- 2 Races
- 4.5 Avg. Finish (Ranks 2nd)
- Best Finish: 1st, Worst: 8th
- Completed 100% of laps (% ranks T1st)
- 79.31% of Laps ran in Top15 (% ranks T3rd)
- 112.2 Average Driver Rating (Ranks 2nd)
- Led 12.64% of laps he’s run (% ranks T2nd)
- 1 Win, 50.0% (% ranks 1st)
- 2 Top 10’s, 100% (% ranks T1st)
- 0 finishes outside Top 20, 0.00% (% ranks T1st)
- 0 DNF’s, 0.00% (% ranks T1st)
- 2 Stage Wins, 50.0% (% ranks 1st)
- 5.0 Stage Pts Per Stage (Ranks T3rd)
Zane Smith is notable because of his race here last year. In Atlanta Smith saw his 4 race Top 2 streak come to an end as he finished 20th after running well most the day. This finish significantly hurt his Avg. Finish this year as it is now 7.67 and ranks 4th in the 2023 Ranks above. The good news is he still has the 2nd best Avg. Driver Rating at 109.4 and has ran 82.57% of his laps in the Top 15. The only real bad stats for Smith are his stages as he only has 3 Stage T10’s with just 24 Stage Points. However this weekend is COTA and the good news train is just getting started. In 3 races on Road Courses last year Smith had a win and two 2nd’s leading to a 1.67 Avg. Finish. Smith also had a 116.93 Avg. Driver Rating and ran over 90% of his laps in the Top 15 while earning 7.0 Stage Pts Per Stage. As the good news train moves along I’ll tell you that the win Smith earned on a Road Course was at COTA where he swept both stages and had a 133.2 Driver Rating. This was the 2nd best Driver Rating in the race, behind only Kyle Busch. Looking at the overall stats for Smith here the news is still good as he has a 4.5 Avg. Finish and a 112.2 Avg. Driver Rating. Furthermore Smith has led 12.64% of the laps here and has ran 79.31% of the laps here in the Top 15. If anyone will stop Kyle Busch from winning it’ll be Smith, but I just don’t see that happening and think Smith will come home somewhere in the Top 5 but not 1st.
9th in Owner Points – Kyle Busch
| Category | Statistic | 2023 Rank | ªRank Thru 3 Races |
| Avg. Fin.¹ | 1.0 | – of 30 | – of 242 |
| Completed Laps%¹ | 100% | – of 30 | – of 242 |
| Laps in Top15%¹ | 95.78% | – of 30 | – of 242 |
| Avg. Driver Rating¹ | 148.8 | – of 30 | – of 242‡ |
| Wins | 1 | T1st of 53 | T3rd of 391 |
| Poles | 1 | T1st of 53 | T2nd of 391 |
| Top 2’s | 1 | T2nd of 53 | T8th of 391 |
| Top 3’s | 1 | T3rd of 53 | T14th of 391 |
| Top 5’s | 1 | T4th of 53 | T23rd of 391 |
| Top 10’s | 1 | T9th of 53 | T61st of 391 |
| DNF’s¹ | 0 | – of 30 | – of 242 |
| Stage Wins | 0 | T6th of 53 | T28th of 342* |
| Stage T10s | 0 | T22nd of 53 | T156th of 342* |
| Stage Pts | 0 | T19th of 53 | T128th of 342* |
| Playoff Pts² | 0 | T6th of 53 | T27th of 342* |
ªSince Playoffs started in 2016
¹Ranks of drivers to start 43% of races thru 3 races
²Earned from races only, does not reflect penalties
*Stage racing started in 2017
‡Max Driver Rating is 150.0
- Notable Streaks this/last year
- none
- 2022 Road Course Stats (Avg. Fin. and Driver Rating rank among drivers with 1+ Road Course start, 51 drivers)
- 2 Races, Avg. Finish 2.0(2nd), 96.69% of Laps ran in Top15, Avg. Driver Rating 142.1(1st), Best 1st, Worst 3rd, Laps Completed 100%, Led 62.81% of laps he ran, 1 Win, 0 Poles, 2 Top 3’s, 2 Top 5’s, 2 Top 10’s, 2 Top 15’s, 0 Finishes out of Top 20, 0 DNF’s, 0 Stage Wins, 2 Stage T10’s
- COTA Statistics
- 2022 COTA Race
- Finished 3rd, Started 5th, Led 31 laps (67.39%), Finished 9th in Stage 1 and 4th in Stage 2, ran 45 Laps in Top15 (97.83% of laps he ran), had 141.7 Driver Rating
- Notable COTA Statistics (Ranks are of drivers with 1+ start this year)
- 1 Race
- 3.0 Avg. Finish (Ranks 1st)
- Best Finish: 3rd, Worst: 3rd
- Completed 100% of laps (% ranks T1st)
- 97.83% of Laps ran in Top15 (% ranks 1st)
- 141.7 Average Driver Rating (Ranks 1st)
- Led 67.39% of laps he’s run (Ranks 1st)
- 0 Top 2’s
- 1 Top 3, 100% (% ranks 1st)
- 0 finishes outside Top 20, 0.00% (% ranks T1st)
- 0 DNF’s, 0.00% (% ranks T1st)
- 0 Stage Wins
- 2 Stage Top 10’s, 100% (% ranks T1st)
Kyle Busch is notable because of how well he ran on Road Courses last year in the Truck Series. Busch’s last race was at Las Vegas where he dominated Stage 3 of the race to pick up the win. That is his only start this year so his stats are quite impressive. In that race he had a 148.8 Driver Rating and ran 95.78% of his laps in the Top 15. Based on his 2 Road Course starts last year there is no reason to think these numbers can’t be just as good this weekend. In the 2 races Busch finished 1st and 3rd with an Avg. Driver Rating of 142.1. Another impressive number is that Busch ran over 96% of his laps on these tracks in the Top 15. At COTA last year Busch led 67.39% of the laps but late race contact while leading demoted him to a 3rd place finish. Even with this finish he still had the best Driver Rating that day at 141.7 and he ran all but 1 lap in the Top 15. This was Busch’s only start here so again his numbers are quite impressive and don’t need any further explanation. So with that all said I’ll make it simple, if Busch doesn’t win on Saturday I would see that as a disappointment for him. In reality as long as nothing goes wrong then Busch should pretty much dominate the race and win.
11th in Points – Tyler Ankrum
| Category | Statistic | 2023 Rank | ªRank Thru 3 Races |
| Avg. Fin.¹ | 16.0 | 13th of 30 | T103rd of 242 |
| Completed Laps%¹ | 99.43% | 12th of 30 | 81st of 242 |
| Laps in Top15%¹ | 54.57% | 13th of 30 | 110th of 242 |
| Avg. Driver Rating¹ | 76.87 | 14th of 30 | 103rd of 242‡ |
| Wins | 0 | T4th of 53 | T23rd of 391 |
| Poles | 0 | T3rd of 53 | T18th of 391 |
| Top 2’s | 0 | T6th of 53 | T42nd of 391 |
| Top 3’s | 0 | T8th of 53 | T59th of 391 |
| Top 5’s | 0 | T13th of 53 | T98th of 391 |
| Top 10’s | 1 | T9th of 53 | T61st of 391 |
| DNF’s¹ | 0 | T1st of 30 | T1st of 242 |
| Stage Wins | 1 | T2nd of 53 | T11th of 342* |
| Stage T10s | 2 | T12th of 53 | T77th of 342* |
| Stage Pts | 14 | T10th of 53 | T62nd of 342* |
| Playoff Pts² | 1 | T3rd of 53 | T19th of 342* |
ªSince Playoffs started in 2016
¹Ranks of drivers to start 43% of races thru 3 races
²Earned from races only, does not reflect penalties
*Stage racing started in 2017
‡Max Driver Rating is 150.0
- Notable Streaks this/last year
- none
- 2022 Road Course Stats (Avg. Fin. and Driver Rating rank among drivers with 1+ Road Course start, 51 drivers)
- 3 Races, Avg. Finish 12.33(10th), 75.0% of Laps ran in Top15, Avg. Driver Rating 87.13(12th), Best 7th, Worst 21st, Laps Completed 100%, Led 0.00% of laps he ran, 0 Wins, 0 Poles, 0 Top 3’s, 0 Top 5’s, 2 Top 10’s, 2 Top 15’s, 1 Finish out of Top 20, 0 DNF’s, 0 Stage Wins, 3.67 Stage Pts Per Stage
- COTA Statistics
- 2022 COTA Race
- Finished 7th, Started 10th, Led 0 laps, Finished 5th in Stage 1, ran 29 Laps in Top15 (63.04% of laps he ran), had 87.8 Driver Rating
- Notable COTA Statistics (Ranks are of drivers with 1+ start this year)
- 2 Races
- 5.0 Avg. Finish (Ranks 3rd)
- Best Finish: 3rd, Worst: 7th
- Completed 100% of laps (% ranks T1st)
- 79.31% of Laps ran in Top15 (% ranks T3rd)
- 103.6 Average Driver Rating (Ranks 3rd)
- Led 4.6% of laps he’s run (% ranks 4th)
- 1 Pole, 50.0% (% ranks 1st)
- 0 Top 2’s
- 1 Top 3, 50.0% (% ranks T2nd)
- 2 Top 10’s, 100% (% ranks T1st)
- 0 finishes outside Top 20, 0.00% (% ranks T1st)
- 0 DNF’s, 0.00% (% ranks T1st)
- 0 Stage Wins
- 3 Stage Top 10’s, 75.0% (% ranks T4th)
- 5.0 Stage Pts Per Stage (Ranks T3rd)
Tyler Ankrum is notable because of his career stats in the 2 races run at COTA. Last week at Atlanta Ankrum was near the front until a wreck on the last lap relegated him to a 26th place finish. In the 3 races this season Ankrum has 1 Top 10, a 16.0 Avg. Finish and a 76.87 Avg. Driver Rating. A couple stats that are more concerning are his 14 Stage Pts and the fact only 54.57% of his laps have been run in the Top 15. This weekend is the first Road Course though, and that may be exactly what Ankrum needs. In the 3 Road Course races last year Ankrum averaged a 12.33 finish with an 87.13 Driver Rating and he ran 75% of his laps in the Top 15. Helping get Ankrum these numbers was the fact he had 2 Top 10’s in the 3 races and got 3.67 Stage Pts Per Stage. One of those Top 10’s was here at COTA where Ankrum ran 63% of his laps in the Top 15 and ended up with a 7th place finish. In the race he also got 6 Stage Pts and his Driver Rating was a respectable 87.8. In the 2 races here this wasn’t even Ankrum’s best showing as his first race here he finished 3rd and got a 119.4 Driver Rating. Altogether his Avg. Finish here is 5.0 and his Avg. Driver Rating is 103.6, this together with his 5.0 Stage Pts Per Stage shows just how good he has been here. With these stats I see Ankrum turning around his struggling start to the season coming home with a solid Top 10 finish, maybe even Top 5.
14th in Owner Points – Ross Chastain
| Category | Statistic | 2023 Rank | ªRank Thru 3 Races |
| Avg. Fin.¹ | 24.0 | – of 30 | – of 242 |
| Completed Laps%¹ | 97.01% | – of 30 | – of 242 |
| Laps in Top15%¹ | 33.08% | – of 30 | – of 242 |
| Avg. Driver Rating¹ | 52.2 | – of 30 | – of 242‡ |
| Wins | 0 | T4th of 53 | T23rd of 391 |
| Poles | 0 | T3rd of 53 | T18th of 391 |
| Top 2’s | 0 | T6th of 53 | T42nd of 391 |
| Top 3’s | 0 | T8th of 53 | T59th of 391 |
| Top 5’s | 0 | T13th of 53 | T98th of 391 |
| Top 10’s | 0 | T22nd of 53 | T167th of 391 |
| DNF’s¹ | 0 | – of 30 | – of 242 |
| Stage Wins | 0 | T6th of 53 | T28th of 342* |
| Stage T10s | 1 | T16th of 53 | T107th of 342* |
| Stage Pts | 0 | T19th of 53 | T128th of 342* |
| Playoff Pts² | 0 | T6th of 53 | T27th of 342* |
ªSince Playoffs started in 2016
¹Ranks of drivers to start 43% of races thru 3 races
²Earned from races only, does not reflect penalties
*Stage racing started in 2017
‡Max Driver Rating is 150.0
- Notable Streaks this/last year
- none
- 2022 Road Course Stats (Avg. Fin. and Driver Rating rank among drivers with 1+ Road Course start, 51 drivers)
- 1 Race, Avg. Finish 4.0(3rd), 94.67% of Laps ran in Top15, Avg. Driver Rating 118.1(2nd), Best 4th, Worst 4th, Laps Completed 100%, Led 25.33% of laps he ran, 0 Wins, 0 Poles, 0 Top 3’s, 1 Top 5, 1 Top 10, 1 Top 15, 0 Finishes out of Top 20, 0 DNF’s, 0 Stage Wins, 0 Stage T10’s
- COTA Statistics
- 2022 COTA Race
- did not race
- Notable COTA Statistics (Ranks are of drivers with 1+ start this year)
- 0 Races
Ross Chastain is notable because of his stats on Road Courses last year. The only race that Chastain ran this year was at Las Vegas and that race didn’t go so well. In that race he finished 24th and only ran 33% of his laps in the Top 15. In addition he had a miniscule 52.2 Driver rating, but he did have 1 Stage T10. These stats could very well be better by the end of Saturday’s Truck race though as Chastain ran well in his one Road Course start last year. In that race Chastain ran 95% of his laps in the Top 15 and led 25% of the race before finishing 4th and acquiring a 118.1 Driver Rating. This is all there is to go off of as he didn’t race at COTA last year in the Truck Series and has actually never raced here in a truck. So with the very little there is to go off of I think Chastain will run well most the race and stay in the Top 15 all day long. In the end I think he is a challenge for Kyle Busch and a viable candidate to win if Busch doesn’t, but in the end I think he ends up finishing 2nd or 3rd.
20th in Owner Points – Kaz Grala
| Category | Statistic | 2023 Rank | ªRank Thru 3 Races |
| Avg. Fin.¹ | 17.0 | – of 30 | – of 242 |
| Completed Laps%¹ | 99.25% | – of 30 | – of 242 |
| Laps in Top15%¹ | 60.15% | – of 30 | – of 242 |
| Avg. Driver Rating¹ | 83.7 | – of 30 | – of 242‡ |
| Wins | 0 | T4th of 53 | T23rd of 391 |
| Poles | 0 | T3rd of 53 | T18th of 391 |
| Top 2’s | 0 | T6th of 53 | T42nd of 391 |
| Top 3’s | 0 | T8th of 53 | T59th of 391 |
| Top 5’s | 0 | T13th of 53 | T98th of 391 |
| Top 10’s | 0 | T22nd of 53 | T167th of 391 |
| DNF’s¹ | 0 | – of 30 | – of 242 |
| Stage Wins | 0 | T6th of 53 | T28th of 342* |
| Stage T10s | 1 | T16th of 53 | T107th of 342* |
| Stage Pts | 0 | T19th of 53 | T128th of 342* |
| Playoff Pts² | 0 | T6th of 53 | T27th of 342* |
ªSince Playoffs started in 2016
¹Ranks of drivers to start 43% of races thru 3 races
²Earned from races only, does not reflect penalties
*Stage racing started in 2017
‡Max Driver Rating is 150.0
- Notable Streaks this/last year
- none
- 2022 Road Course Stats (Avg. Fin. and Driver Rating rank among drivers with 1+ Road Course start, 51 drivers)
- 3 Races, Avg. Finish 11.67(8th), 70.74% of Laps ran in Top15, Avg. Driver Rating 80.23(15th), Best 7th, Worst 14th, Laps Completed 100%, Led 0.00% of laps he ran, 0 Wins, 0 Poles, 0 Top 3’s, 0 Top 5’s, 1 Top 10, 3 Top 15’s, 0 Finishes out of Top 20, 0 DNF’s, 0 Stage Wins, 1.5 Stage Pts Per Stage
- COTA Statistics
- 2022 COTA Race
- Finished 14th, Started 18th, Led 0 laps, got 0 Stage T10’s, ran 26 Laps in Top15 (56.52% of laps he ran), had 73.2 Driver Rating
- Notable COTA Statistics (Ranks are of drivers with 1+ start this year)
- 2 Races
- 8.0 Avg. Finish (Ranks 8th)
- Best Finish: 2nd, Worst: 14th
- Completed 100% of laps (% ranks T1st)
- 77.01% of Laps ran in Top15 (% ranks 5th)
- 99.7 Average Driver Rating (Ranks 5th)
- Led 12.64% of laps he’s run (% ranks T2nd)
- 0 Wins
- 1 Top 2, 50.0% (% ranks T1st)
- 2 Top 15’s, 100% (% ranks T1st)
- 0 finishes outside Top 20, 0.00% (% ranks T1st)
- 0 DNF’s, 0.00% (% ranks T1st)
- 0 Stage Wins
- 2 Stage Top 10, 50.0% (% ranks T8th)
Kaz Grala is notable because of his really good career stats here at COTA. The last race Grala competed in the Truck Series was at Las Vegas and was his only race this year so far. In the race Grala ended up with a 17th place finish after running 60% of his laps in the Top 15 and leaving with an 83.7 Driver Rating, he also got 1 Stage T10. That’s all there is to say about Grala this year but last year he ran really well in the 3 Road Course tracks he raced on. In the 3 races Grala had only 1 Top 10 but his worst finish was only 14th and he ran 70% of his laps in the Top 15. This led to Grala having an 11.67 Avg. Finish and an 80.23 Avg. Driver rating. In the race here at COTA he ran a little over 50% of his laps in the Top 15 and ended up finishing 14th with a 73.2 Driver Rating. This was Grala’s 2nd race here and it definitely didn’t go as well as his first. In the first race Grala finished 2nd and had a 126.2 Driver Rating. Put together these two races have given Grala an 8.0 Avg. Finish while running 77% of his laps in the Top 15 and acquiring a 99.7 Avg. Driver Rating. In addition to this he’s also led 12.64% of his laps ran here and has 2 Stage T10’s in the 2 races. With all these stats put together I see a decent day ahead for Grala at COTA this weekend, I think he ends up running most the race in the Top 15 and finishes the day somewhere between 4th and 9th.