
1st in Points – Christopher Bell
| Category | Statistic | 2023 Rank | ªRank Thru 10 Races |
| Avg. Fin.¹ | 10.9 | 2nd of 38 | T58th of 851 |
| Completed Laps%¹ | 95.58% | 26th of 38 | 432nd of 851 |
| Laps in Top15%¹ | 71.79% | 6th of 38 | 125th of 806‡ |
| Avg. Driver Rating¹ | 90.89 | 5th of 38 | 158th of 806‡ |
| Wins | 1 | T4th of 51 | T49th of 1074 |
| Poles | 0 | T7th of 51 | T128th of 1074 |
| Top 2’s | 1 | T7th of 51 | T106th of 1074 |
| Top 3’s | 3 | T1st of 51 | T42nd of 1074 |
| Top 5’s | 5 | 1st of 51 | T24th of 1074 |
| Top 10’s | 7 | 1st of 51 | T23rd of 1074 |
| DNF’s¹ | 2 | T22nd of 38 | T540th of 851 |
| Stage Wins | 0 | T13th of 51 | T74th of 351* |
| Stage T10s | 11 | T6th of 51 | T45th of 351* |
| Stage Pts | 57 | 8th of 51 | T55th of 351* |
| Playoff Pts² | 5 | T6th of 51 | T37th of 351* |
ªSince Playoffs started in 2004
¹Ranks of drivers to start 40% of races thru 10 races
²Earned from races only, does not reflect penalties
*Stage racing started in 2017
‡Loop Data started in 2005, max Driver Rating is 150.0
- Notable Streaks this year
- 2 straight Top 5 finishes
- 3 straight Top 10 finishes
- 2022/23 Small Track Stats (Avg. Fin. and Driver Rating rank among drivers with 1+ Small Track start, 45 drivers)
- 6 Races, Avg. Finish 9.33(3rd), 75.65% of Laps ran in Top15, Avg. Driver Rating 96.18(7th), Best 1st, Worst 26th, Laps Completed 99.89%, Led 2.23% of laps he ran, 1 Win, 0 Poles, 1 Top 3, 2 Top 5’s, 5 Top 10’s, 5 Top 15’s, 1 Finish out of Top 20, 0 DNF’s, 0 Stage Wins, 3.17 Stage Pts Per Stage
- Dover Statistics
- 2022 Dover Race
- Finished 4th, Started 17th, Led 0 laps, Finished 3rd in Stage 1, ran 206 Laps in Top15 (51.5% of laps he ran), had 91.6 Driver Rating (ranked 9th)
- Notable Dover Statistics (Ranks are of drivers with 1+ start this year)
- 4 Races
- 18.5 Avg. Finish (Ranks 17th)
- Best Finish: 4th, Worst: 27th
- Completed 99.51% of laps (% ranks 6th)
- 23.39% of Laps ran in Top15 (% ranks 22nd)
- 69.1 Average Driver Rating (Ranks 20th)
- Led 0.00% of laps he’s run
- 0 Top 3’s
- 1 Top 5, 25.0% (% ranks T7th)
- 1 Top 15, 25.0% (% ranks T21st)
- 3 finishes outside Top 20, 75.0% (% ranks 26th)
- 0 DNF’s, 0.00% (% ranks T1st)
- 0 Stage Wins
- 1.0 Stage Pts Per Stage (Ranks 14th)
Christopher Bell is notable because of how well he’s done in the 2023 season. Last week Bell ran half of his laps in the Top 15 and when the carnage was over found himself P8. This improved Bell’s Avg. Finish to 10.9, 2nd best this year, and was his series leading 7th Top 10. In addition his 5 Top 5’s leads the series, and his 3 Top 3’s are tied for the most this year. It’s not just finishes either, his 90.89 Avg. Driver Rating ranks 5th best and he’s ran 71.79% of his laps in the Top 15, which ranks 6th best. Worse news for the competition is that this weekend is a Small track where Bell’s 9.33 Avg. Finish in the last 6 Small tracks ranks 3rd. Moreover his 96.18 Avg. Driver Rating ranks 7th and he has 1 Win with 5 Top 10’s in the 6 races while running 75% of his laps in the Top 15. At the Dover race last year he came home with a 4th place finish after spending 51.5% of his laps in the Top 15 as an unscheduled pit stop put him behind the ball most the race. However he did finish 3rd in Stage 1 and ended with the 9th best Avg. Driver Rating at 91.6. This race was Bell’s only Top 15 finish here in 4 races as his Avg. Finish finish here is 18.5 and he’s only spent 23.39% of his laps in the Top 15 as well. This does not bode well for Bell this weekend but with the way he’s running this year, and the way he did here last year, I see him getting a solid Top 10 finish this weekend.
2nd in Points – Ross Chastain
| Category | Statistic | 2023 Rank | ªRank Thru 10 Races |
| Avg. Fin.¹ | 13.2 | T4th of 38 | T122nd of 851 |
| Completed Laps%¹ | 99.96% | 3rd of 38 | T24th of 851 |
| Laps in Top15%¹ | 68.42% | 7th of 38 | 157th of 806‡ |
| Avg. Driver Rating¹ | 88.29 | 7th of 38 | 180th of 806‡ |
| Wins | 0 | T8th of 51 | T142nd of 1074 |
| Poles | 0 | T7th of 51 | T128th of 1074 |
| Top 2’s | 0 | T12th of 51 | T227th of 1074 |
| Top 3’s | 2 | T6th of 51 | T79th of 1074 |
| Top 5’s | 3 | T4th of 51 | T96th of 1074 |
| Top 10’s | 4 | T7th of 51 | T183rd of 1074 |
| DNF’s¹ | 0 | T1st of 38 | T1st of 851 |
| Stage Wins | 3 | 2nd of 51 | T10th of 351* |
| Stage T10s | 12 | T2nd of 51 | T33rd of 351* |
| Stage Pts | 81 | 2nd of 51 | T28th of 351* |
| Playoff Pts² | 3 | 8th of 51 | T52nd of 351* |
ªSince Playoffs started in 2004
¹Ranks of drivers to start 40% of races thru 10 races
²Earned from races only, does not reflect penalties
*Stage racing started in 2017
‡Loop Data started in 2005, max Driver Rating is 150.0
- Notable Streaks this year
- 2 straight Top 5 finishes
- 2022/23 Small Track Stats (Avg. Fin. and Driver Rating rank among drivers with 1+ Small Track start, 45 drivers)
- 6 Races, Avg. Finish 8.0(2nd), 90.73% of Laps ran in Top15, Avg. Driver Rating 97.62(6th), Best 2nd, Worst 24th, Laps Completed 100%, Led 4.61% of laps he ran, 0 Wins, 0 Poles, 3 Top 3’s, 3 Top 5’s, 5 Top 10’s, 5 Top 15’s, 1 Finish out of Top 20, 0 DNF’s, 0 Stage Wins, 2.67 Stage Pts Per Stage
- Dover Statistics
- 2022 Dover Race
- Finished 3rd, Started 7th, Led 86 laps (21.5%), Finished 4th in Stage 1 and 6th in Stage 2, ran 397 Laps in Top15 (99.25% of laps he ran), had 125.2 Driver Rating (ranked 2nd)
- Notable Dover Statistics (Ranks are of drivers with 1+ start this year)
- 8 Races
- 25.25 Avg. Finish (Ranks 28th)
- Best Finish: 3rd, Worst: 38th
- Completed 94.3% of laps (% ranks 26th)
- 22.4% of Laps ran in Top15 (% ranks 23rd)
- 53.73 Average Driver Rating (Ranks 25th)
- Led 2.84% of laps he’s run (% ranks 11th)
- 0 Top 2’s
- 1 Top 3, 12.5% (% ranks T8th)
- 1 Top 10, 12.5% (% ranks 21st)
- 2 Top 15’s, 25.0% (% ranks T21st)
- 5 finishes outside Top 20, 62.5% (% ranks T22nd)
- 1 DNF, 12.5% (% ranks T28th)
- 0 Stage Wins
- 2 Stage T10’s, 12.5% (% ranks T20th)
Ross Chastain is notable because he is 2nd in points thru 10 races this year. Last week Chastain was going for the lead when he was ran into by Noah Gragson causing a big crash and eventually had Chastain finish 22nd in the race. This dropped his Avg. Finish to 13.2, T4th best, and his Avg. Driver Rating is now 88.29, 7th best. His best stats are his stage stats where his 3 Stage Wins, 12 Stage T10’s, and 81 Stage Pts all rank 2nd or T2nd. However his finishes aren’t as good as he only has 4 Top 10’s which is tied for 7th most. That may improve this weekend, however, as in the last 6 Small track races Chastain has an 8.0 Avg. Finish (2nd best) with 3 Top 3’s and 5 Top 10’s while completing every lap as well. He’s ran 90.73% of those laps in the Top 15 and his 97.62 Avg. Driver Rating ranks 6th, but he has just 2.67 Stage Pts Per Stage as well. One of his better races in this span was at Dover last year where he finished 3rd, led 86 laps, and got 12 Stage Pts. In addition he ran all but 3 laps in the Top 15 and his 125.2 Driver Rating was only bested by race winner Chase Elliott. This was definitely his best race at Dover as it is his only Top 10 and just his 2nd Top 15 in 8 races. In all he has a 25.25 Avg. Finish, ran 22.4% of his laps in the Top 15, and has a 53.73 Avg. Driver Rating. However, taking all the stats in I see Chastain running well like he did last year and getting another Top 5 at Dover this weekend.
4th in Points – Kyle Larson
| Category | Statistic | 2023 Rank | ªRank Thru 10 Races |
| Avg. Fin.¹ | 16.8 | 17th of 38 | T278th of 851 |
| Completed Laps%¹ | 94.27% | 30th of 38 | 499th of 851 |
| Laps in Top15%¹ | 75.55% | 3rd of 38 | 91st of 806‡ |
| Avg. Driver Rating¹ | 96.7 | 2nd of 38 | 92nd of 806‡ |
| Wins | 2 | T1st of 51 | T11th of 1074 |
| Poles | 2 | T1st of 51 | T10th of 1074 |
| Top 2’s | 3 | T1st of 51 | T17th of 1074 |
| Top 3’s | 3 | T1st of 51 | T42nd of 1074 |
| Top 5’s | 4 | T2nd of 51 | T47th of 1074 |
| Top 10’s | 4 | T7th of 51 | T183rd of 1074 |
| DNF’s¹ | 4 | T36th of 38 | T804th of 851 |
| Stage Wins | 2 | T3rd of 51 | T17th of 351* |
| Stage T10s | 12 | T2nd of 51 | T33rd of 351* |
| Stage Pts | 80 | 3rd of 51 | T31st of 351* |
| Playoff Pts² | 12 | 2nd of 51 | T5th of 351* |
ªSince Playoffs started in 2004
¹Ranks of drivers to start 40% of races thru 10 races
²Earned from races only, does not reflect penalties
*Stage racing started in 2017
‡Loop Data started in 2005, max Driver Rating is 150.0
- Notable Streaks this year
- 2 straight Top 5 finishes
- 2022/23 Small Track Stats (Avg. Fin. and Driver Rating rank among drivers with 1+ Small Track start, 45 drivers)
- 6 Races, Avg. Finish 13.17(12th), 88.53% of Laps ran in Top15, Avg. Driver Rating 98.38(4th), Best 4th, Worst 34th, Laps Completed 96.08%, Led 12.24% of laps he ran, 0 Wins, 1 Pole, 0 Top 3’s, 1 Top 5, 3 Top 10’s, 5 Top 15’s, 1 Finish out of Top 20, 1 DNF, 1 Stage Win, 5.42 Stage Pts Per Stage
- Dover Statistics
- 2022 Dover Race
- Finished 6th, Started 3rd, Led 19 laps (4.75%), Finished 6th in Stage 1, ran 309 Laps in Top15 (77.25% of laps he ran), had 99.7 Driver Rating (ranked 8th)
- Notable Dover Statistics (Ranks are of drivers with 1+ start this year)
- 14 Races
- 6.93 Avg. Finish (Ranks 1st)
- Best Finish: 1st, Worst: 25th
- Completed 99.89% of laps (% ranks 2nd)
- 78.84% of Laps ran in Top15 (% ranks 5th)
- 106.01 Average Driver Rating (Ranks 2nd)
- Led 16.03% of laps he’s run (Ranks 2nd)
- 1 Win, 7.14% (% ranks T6th)
- 4 Top 2’s, 28.57% (% ranks 2nd)
- 7 Top 5’s, 50.0% (% ranks 2nd)
- 11 Top 10’s, 78.57% (% ranks 1st)
- 13 Top 15’s, 92.86% (% ranks 2nd)
- 1 finish outside Top 20, 7.14% (% ranks 2nd)
- 0 DNF’s, 0.00% (% ranks T1st)
- 3 Stage Wins, 18.75% (% ranks 4th)
- 11 Stage Top 10’s, 68.75% (% ranks T5th)
- 5.25 Stage Pts Per Stage (Ranks 3rd)
Kyle Larson is notable because of his incredible stats at Dover in his 14 career starts. After last week I am just thankful Larson is alive after a vicious hit from Ryan Preece’s car had him finish 33rd. On the year Larson has 2 Wins, 3 Top 2’s, and 4 Top 5’s but also 4 DNF’s in 10 races this year leading to his disappointing 16.8 Avg. Finish. The good news is that most of Larson’s 2023 Ranks above are 1st or 2nd including, but not limited to, his 75.55 Laps in Top15%, 96.7 Avg. Driver Rating, 2 Stage Wins, and 80 Stage Pts. This week is a Small track and in the last 6 Small track races he has a 13.17 Avg. Finish (12th best) and a 98.38 Avg. Driver Rating (4th best). In fact Larson has ran 88.53% of his laps in the Top 15 with 5.42 Stage Pts Per Stage to show for it, however his best finish in the 6 races is only 4th. What’s more is that 4th is his only Top 5. He was close to a Top 5 last year at Dover as he finished 6th after leading 19 laps and accumulating 5 Stage Pts. In the race Larson ran 77.25% of his laps in the Top 15 and had the 8th best Driver Rating at 99.7. Overall at Dover he has the best Avg. Finish among active drivers at 6.93 and the 2nd best Avg. Driver Rating at 106.01. As a matter of fact 10 of his Dover ranks above are 1st or 2nd and he’s finished 78.57% of his races in the Top 10. Taking all this in if he doesn’t DNF then a Top 10 is a lock for Larson this weekend and a Top 5 is likely with a shot at the Win.
5th in Points – Kyle Busch
| Category | Statistic | 2023 Rank | ªRank Thru 10 Races |
| Avg. Fin.¹ | 12.2 | 3rd of 38 | T96th of 851 |
| Completed Laps%¹ | 99.42% | 13th of 38 | T142nd of 851 |
| Laps in Top15%¹ | 64.2% | 10th of 38 | 197th of 806‡ |
| Avg. Driver Rating¹ | 85.13 | 10th of 38 | 219th of 806‡ |
| Wins | 2 | T1st of 51 | T11th of 1074 |
| Poles | 0 | T7th of 51 | T128th of 1074 |
| Top 2’s | 3 | T1st of 51 | T17th of 1074 |
| Top 3’s | 3 | T1st of 51 | T42nd of 1074 |
| Top 5’s | 3 | T4th of 51 | T96th of 1074 |
| Top 10’s | 5 | T3rd of 51 | T104th of 1074 |
| DNF’s¹ | 2 | T22nd of 38 | T540th of 851 |
| Stage Wins | 0 | T13th of 51 | T74th of 351* |
| Stage T10s | 7 | T11th of 51 | T84th of 351* |
| Stage Pts | 34 | 13th of 51 | 83rd of 351* |
| Playoff Pts² | 10 | 3rd of 51 | T16th of 351* |
ªSince Playoffs started in 2004
¹Ranks of drivers to start 40% of races thru 10 races
²Earned from races only, does not reflect penalties
*Stage racing started in 2017
‡Loop Data started in 2005, max Driver Rating is 150.0
- Notable Streaks this year
- 3 straight Top 10 finishes
- 2022/23 Small Track Stats (Avg. Fin. and Driver Rating rank among drivers with 1+ Small Track start, 45 drivers)
- 6 Races, Avg. Finish 7.17(1st), 74.99% of Laps ran in Top15, Avg. Driver Rating 98.05(5th), Best 2nd, Worst 12th, Laps Completed 100%, Led 8.96% of laps he ran, 0 Wins, 0 Poles, 1 Top 3, 1 Top 5, 5 Top 10’s, 6 Top 15’s, 0 Finishes out of Top 20, 0 DNF’s, 0 Stage Wins, 1.92 Stage Pts Per Stage
- Dover Statistics
- 2022 Dover Race
- Finished 7th, Started 10th, Led 103 laps (25.75%), Finished 9th in Stage 1 and 2nd in Stage 2, ran 390 Laps in Top15 (97.5% of laps he ran), had 120.7 Driver Rating (ranked 3rd)
- Notable Dover Statistics (Ranks are of drivers with 1+ start this year)
- 34 Races
- 14.03 Avg. Finish (Ranks 12th)
- Best Finish: 1st, Worst: 43rd
- Completed 90.57% of laps (% ranks 30th)
- 85.97% of Laps ran in Top15 (% ranks 2nd)
- 102.48 Average Driver Rating (Ranks 3rd)
- Led 10.81% of laps he’s run (% ranks 3rd)
- 3 Wins, 8.82% (% ranks 4th)
- 7 Top 2’s, 20.59% (% ranks 4th)
- 13 Top 5’s, 38.24% (% ranks 5th)
- 21 Top 10’s, 61.76% (% ranks 4th)
- 10 finishes outside Top 20, 29.41% (% ranks 15th)
- 7 DNF’s, 20.59% (% ranks 33rd)
- 0 Stage Wins
- 13 Stage T10’s, 65.0% (% ranks T7th)
- 3.9 Stage Pts Per Stage (Ranks 6th)
Kyle Busch is notable because of how well he’s done in the last 6 Small track races in the Cup Series. At Talladega Busch was the beneficiary of Bubba Wallace’s bad block and won his 2nd race of the year. Unfortunately for Busch this was also just his 3rd Top 2/Top 5, but he has 5 Top 10’s so he still has the 3rd best Avg. Finish this year at 12.2. However, he hasn’t been running as good as he’s finishing as he’s only ran 64.2% of his laps in the Top 15 and his 85.13 Avg. Driver Rating ranks just 10th best this year. What’s more is that Busch has 7 Stage T10’s and 34 Stage Pts in 20 stages this year. That may not change this week as in the last 6 Small track races he’s score 1.92 Stage Pts Per Stage, but, even with only 1 Top 5, he does have the best Avg. Finish at 7.17. This is because he has 5 Top 10’s with a worst finish of just 12th. In addition he has the 5th best Avg. Driver Rating at 98.05, and has led 9% of his laps. At Dover last year Busch led 25% of the race, got 11 Stage Pts, and ran 97.5% of his laps in the Top 15 before finishing 7th in the race. He left that day with the 3rd best Driver Rating as well at 120.7 which raised his Avg. Driver Rating here to 102.48 (3rd best). His 14.03 Avg. Finish, however, ranks 12th as he has 3 Wins with 21 Top 10’s, but 10 finishes out of the Top 20 with 7 DNF’s as well. Busch is a little hard to handicap based on his inconsistency this year but I think he gets a Top 10 finish, between 4th and 10th.
7th in Points – Martin Truex Jr.
| Category | Statistic | 2023 Rank | ªRank Thru 10 Races |
| Avg. Fin.¹ | 13.4 | 6th of 38 | T128th of 851 |
| Completed Laps%¹ | 100% | T1st of 38 | T1st of 851 |
| Laps in Top15%¹ | 64.78% | 9th of 38 | 189th of 806‡ |
| Avg. Driver Rating¹ | 85.8 | 9th of 38 | 213th of 806‡ |
| Wins | 0 | T8th of 51 | T142nd of 1074 |
| Poles | 0 | T7th of 51 | T128th of 1074 |
| Top 2’s | 0 | T12th of 51 | T227th of 1074 |
| Top 3’s | 1 | T10th of 51 | T162nd of 1074 |
| Top 5’s | 1 | T15th of 51 | T254th of 1074 |
| Top 10’s | 3 | T16th of 51 | T265th of 1074 |
| DNF’s¹ | 0 | T1st of 38 | T1st of 851 |
| Stage Wins | 0 | T13th of 51 | T74th of 351* |
| Stage T10s | 10 | T8th of 51 | T54th of 351* |
| Stage Pts | 42 | 11th of 51 | 74th of 351* |
| Playoff Pts² | 0 | T16th of 51 | T89th of 351* |
ªSince Playoffs started in 2004
¹Ranks of drivers to start 40% of races thru 10 races
²Earned from races only, does not reflect penalties
*Stage racing started in 2017
‡Loop Data started in 2005, max Driver Rating is 150.0
- Notable Streaks this year
- 2 straight Top 10 finishes
- 2022/23 Small Track Stats (Avg. Fin. and Driver Rating rank among drivers with 1+ Small Track start, 45 drivers)
- 6 Races, Avg. Finish 14.83(14th), 75.36% of Laps ran in Top15, Avg. Driver Rating 95.88(8th), Best 4th, Worst 35th, Laps Completed 95.07%, Led 12.21% of laps he ran, 0 Wins, 1 Pole, 0 Top 3’s, 1 Top 5, 2 Top 10’s, 4 Top 15’s, 1 Finish out of Top 20, 1 DNF, 2 Stage Wins, 4.67 Stage Pts Per Stage
- Dover Statistics
- 2022 Dover Race
- Finished 12th, Started 18th, Led 5 laps (1.25%), Finished 5th in Stage 1 and 4th in Stage 2, ran 343 Laps in Top15 (85.75% of laps he ran), had 104.7 Driver Rating (ranked 5th)
- Notable Dover Statistics (Ranks are of drivers with 1+ start this year)
- 32 Races
- 11.75 Avg. Finish (Ranks 5th)
- Best Finish: 1st, Worst: 38th
- Completed 97.65% of laps (% ranks 18th)
- 76.32% of Laps ran in Top15 (% ranks 6th)
- 100.51 Average Driver Rating (Ranks 4th)
- Led 8.11% of laps he’s run (% ranks 6th)
- 3 Wins, 9.38% (% ranks 3rd)
- 3 Poles, 9.38% (% ranks 2nd)
- 6 Top 2’s, 18.75% (% ranks 5th)
- 18 Top 10’s, 56.25% (% ranks 6th)
- 24 Top 15’s, 75.0% (% ranks 6th)
- 6 finishes outside Top 20, 18.75% (% ranks 7th)
- 2 DNF’s, 6.25% (% ranks 21st)
- 4 Stage Wins, 20.0% (% ranks T2nd)
- 15 Stage T10’s, 75.0% (% ranks 3rd)
- 5.7 Stage Pts Per Stage (Ranks 2nd)
Martin Truex Jr. is notable because of how well he has done at Dover over the course of his career. Last week Truex was one of many that was involved in the last lap incident and this relegated him to a 27th place finish. This was Truex’s first finish out of the Top 20 this year, but he also has just 1 Top 5 and 3 Top 10’s. Still, his 13.4 Avg. Finish ranks 6th and his 85.8 Avg. Driver Rating ranks 9th, as does his 64.78 Laps in Top15%. The bad news is that this week is a Small track where in the last 6 races he has a 14.83 Avg. Finish with only 1 Top 5, 2 Top 10’s, and 4 Top 15’s. The good news for Truex is that his 95.88 Avg. Driver Rating ranks 8th and he won 2 stages while getting 4.67 Stage Pts Per Stage. Last year at Dover Truex finished 12th after a last lap wreck racing for 3rd with Ross Chastain. Even with this he still had the 5th best Driver Rating in the race at 104.7, and got 13 Stage Pts in the race too. This is very typical of Truex at Dover as his Avg. Finish in 32 races is 11.75 (ranks 5th) and his Avg. Driver Rating is 100.51 (ranks 4th) with 5.7 Stage Pts Per Stage (ranks 2nd). In his 32 races he’s led 8% of his laps here, has 3 Wins, 6 Top 2’s, and 18 Top 10’s with only 6 finishes out of the Top 20. This year Truex hasn’t been great, but hasn’t been terrible either and with the Dover stats in his favor I think this could be his best race yet. I think Truex finishes somewhere between 1st and 8th if nothing goes wrong.
8th in Points – Ryan Blaney
| Category | Statistic | 2023 Rank | ªRank Thru 10 Races |
| Avg. Fin.¹ | 13.5 | 7th of 38 | T131st of 851 |
| Completed Laps%¹ | 99.81% | 6th of 38 | T63rd of 851 |
| Laps in Top15%¹ | 61.88% | 11th of 38 | 207th of 806‡ |
| Avg. Driver Rating¹ | 82.42 | 11th of 38 | T241st of 806‡ |
| Wins | 0 | T8th of 51 | T142nd of 1074 |
| Poles | 0 | T7th of 51 | T128th of 1074 |
| Top 2’s | 2 | T4th of 51 | T46th of 1074 |
| Top 3’s | 2 | T6th of 51 | T79th of 1074 |
| Top 5’s | 2 | T11th of 51 | T167th of 1074 |
| Top 10’s | 5 | T3rd of 51 | T104th of 1074 |
| DNF’s¹ | 0 | T1st of 38 | T1st of 851 |
| Stage Wins | 0 | T13th of 51 | T74th of 351* |
| Stage T10s | 6 | T15th of 51 | T98th of 351* |
| Stage Pts | 33 | T14th of 51 | T84th of 351* |
| Playoff Pts² | 0 | T16th of 51 | T89th of 351* |
ªSince Playoffs started in 2004
¹Ranks of drivers to start 40% of races thru 10 races
²Earned from races only, does not reflect penalties
*Stage racing started in 2017
‡Loop Data started in 2005, max Driver Rating is 150.0
- Notable Streaks this year
- 2 straight Top 10 finishes (active streak)
- 2022/23 Small Track Stats (Avg. Fin. and Driver Rating rank among drivers with 1+ Small Track start, 45 drivers)
- 6 Races, Avg. Finish 9.33(3rd), 72.49% of Laps ran in Top15, Avg. Driver Rating 101.72(2nd), Best 2nd, Worst 26th, Laps Completed 99.79%, Led 14.45% of laps he ran, 0 Wins, 1 Pole, 2 Top 3’s, 4 Top 5’s, 4 Top 10’s, 4 Top 15’s, 1 Finish out of Top 20, 0 DNF’s, 3 Stage Wins, 4.75 Stage Pts Per Stage
- Dover Statistics
- 2022 Dover Race
- Finished 26th, Started 5th, Led 0 laps, Finished 1st in Stage 2, ran 131 Laps in Top15 (33.0% of laps he ran), had 67.6 Driver Rating (ranked 15th)
- Notable Dover Statistics (Ranks are of drivers with 1+ start this year)
- 12 Races
- 19.5 Avg. Finish (Ranks 19th)
- Best Finish: 8th, Worst: 38th
- Completed 94.32% of laps (% ranks 25th)
- 70.18% of Laps ran in Top15 (% ranks 11th)
- 83.63 Average Driver Rating (Ranks 11th)
- Led 1.03% of laps he’s run (% ranks 14th)
- 0 Top 5’s
- 2 Top 10’s, 16.67% (% ranks 19th)
- 7 Top 15’s, 58.33% (% ranks 13th)
- 5 finishes outside Top 20, 41.67% (% ranks 18th)
- 1 DNF, 8.33% (% ranks T22nd)
- 1 Stage Win, 5.0% (% ranks T5th)
- 13 Stage T10’s, 65.0% (% ranks T7th)
Ryan Blaney is notable because of how he has done on Small tracks in 2022/23. At Talladega Blaney came oh so close to his first win in 56 races, but alas he finished 2nd, again. This was his 2nd Top 2 of the year, but also his 2nd Top 5 as well. Blaney does have 5 Top 10’s though and the 7th best Avg. Finish this year at 13.5. What’s even worse is that he’s ran just 62% of his laps in the Top 15, has the 11th best Avg. Driver Rating at 82.42, and has just 33 Stage Pts. The good news is he’s riding a 2 race Top 10 streak and is heading to a track style, Small tracks where he had 4 Top 5’s in the last 6 races. These are also is only Top 15’s though which has his Avg. Finish sitting at 9.33 (3rd best), and his Avg. Driver Rating at 101.72 (2nd best). In addition to these impressive stats Blaney has also led 14.45% of his laps in the 6 races and has 3 Stage Wins in the 12 stages with 4.75 Stage Pts Per Stage to boot. Unfortunately for Blaney his worst of these races was at Dover last year where he finished 26th running just 33% of his laps in the Top 15 and ended with the 15th best Driver Rating at 67.6. This is common for him here as in 12 races he has just 2 Top 10’s but has 7 Top 15’s too. However he also has 5 finishes out of the Top 20 leading to a 19.5 Avg. Finish and his Avg. Driver Rating is just 83.63. Based on the stats I don’t see Dover as a track Blaney will succeed at as I think he finishes at best 5th, but most likely between 9th and 15th.
9th in Points – Alex Bowman
| Category | Statistic | 2023 Rank | ªRank Thru 10 Races |
| Avg. Fin.¹ | 10.3 | 1st of 38 | T45th of 851 |
| Completed Laps%¹ | 99.92% | 4th of 38 | T34th of 851 |
| Laps in Top15%¹ | 81.94% | 1st of 38 | 48th of 806‡ |
| Avg. Driver Rating¹ | 91.25 | 3rd of 38 | 152nd of 806‡ |
| Wins | 0 | T8th of 51 | T142nd of 1074 |
| Poles | 1 | T3rd of 51 | T31st of 1074 |
| Top 2’s | 0 | T12th of 51 | T227th of 1074 |
| Top 3’s | 2 | T6th of 51 | T79th of 1074 |
| Top 5’s | 3 | T4th of 51 | T96th of 1074 |
| Top 10’s | 6 | 2nd of 51 | T55th of 1074 |
| DNF’s¹ | 0 | T1st of 38 | T1st of 851 |
| Stage Wins | 0 | T13th of 51 | T74th of 351* |
| Stage T10s | 10 | T8th of 51 | T54th of 351* |
| Stage Pts | 63 | 6th of 51 | T47th of 351* |
| Playoff Pts² | 0 | T16th of 51 | T89th of 351* |
ªSince Playoffs started in 2004
¹Ranks of drivers to start 40% of races thru 10 races
²Earned from races only, does not reflect penalties
*Stage racing started in 2017
‡Loop Data started in 2005, max Driver Rating is 150.0
- Notable Streaks this year
- 4 straight Top 10 finishes
- 2022/23 Small Track Stats (Avg. Fin. and Driver Rating rank among drivers with 1+ Small Track start, 45 drivers)
- 6 Races, Avg. Finish 18.33(21st), 68.77% of Laps ran in Top15, Avg. Driver Rating 72.5(16th), Best 5th, Worst 35th, Laps Completed 83.84%, Led 0.19% of laps he ran, 0 Wins, 0 Poles, 0 Top 3’s, 1 Top 5, 2 Top 10’s, 4 Top 15’s, 2 Finishes out of Top 20, 1 DNF, 0 Stage Wins, 1.17 Stage Pts Per Stage
- Dover Statistics
- 2022 Dover Race
- Finished 5th, Started 6th, Led 2 laps (0.5%), Finished 3rd in Stage 2, ran 393 Laps in Top15 (98.25% of laps he ran), had 109.1 Driver Rating (ranked 4th)
- Notable Dover Statistics (Ranks are of drivers with 1+ start this year)
- 12 Races
- 17.83 Avg. Finish (Ranks 16th)
- Best Finish: 1st, Worst: 40th
- Completed 95.16% of laps (% ranks 24th)
- 50.69% of Laps ran in Top15 (% ranks 16th)
- 77.96 Average Driver Rating (Ranks 14th)
- Led 3.22% of laps he’s run (% ranks 10th)
- 1 Win, 8.33% (% ranks 5th)
- 3 Top 3’s, 25.0% (% ranks 4th)
- 5 Top 5’s, 41.67% (% ranks 4th)
- 5 Top 15’s, 41.67% (% ranks 18th)
- 6 finishes outside Top 20, 50.0% (% ranks T19th)
- 2 DNF’s, 16.67% (% ranks T30th)
- 0 Stage Wins
- 8 Stage T10’s, 50.0% (% ranks T10th)
Alex Bowman is notable because of his 2023 stats, especially Avg. Finish and Avg. Driver Rating. Last week Bowman had a Bowman day as he ran okay most of the race and ended up 14th. This now has his Avg. Finish at 10.3, best of anyone this year, and his Avg. Driver Rating at 91.25, 3rd best. Some more good stat are that he’s ran 82% of his laps in the Top 15 this year and his 6 Top 10’s are the 2nd most this year. Furthermore he has 2 Top 3’s, 3 Top 5’s and 63 Stage Pts in the 10 races this year. However, this is where the good news stops for a bit as in the last 6 Small track races Bowman has just 1 Top 5, and 2 Top 10’s with 2 finishes out of the Top 20 leading to an 18.33 Avg. Finish. In addition he has scored just 1.17 Stage Pts Per Stage and his Avg. Driver Rating is only 72.5. The good news is his only Top 5 came here at Dover where he ran 98.25% of his laps in the Top 15 en route to finishing 5th with the 4th best Driver Rating at 109.1. This is typical of Bowman here in the last 6 races as he has 5 Top 5’s in that span but those are his only Top 15 finishes in his 12 career starts here as well. Overall he has a 17.83 Avg. Finish with 50.69% of his laps being run in the Top 15 and a 77.96 Avg. Driver Rating. However, based on his recent success here I think Bowman is a potential sleeper this weekend to steal a win, but I think for sure he finishes Top 10 and probably Top 5 at that.
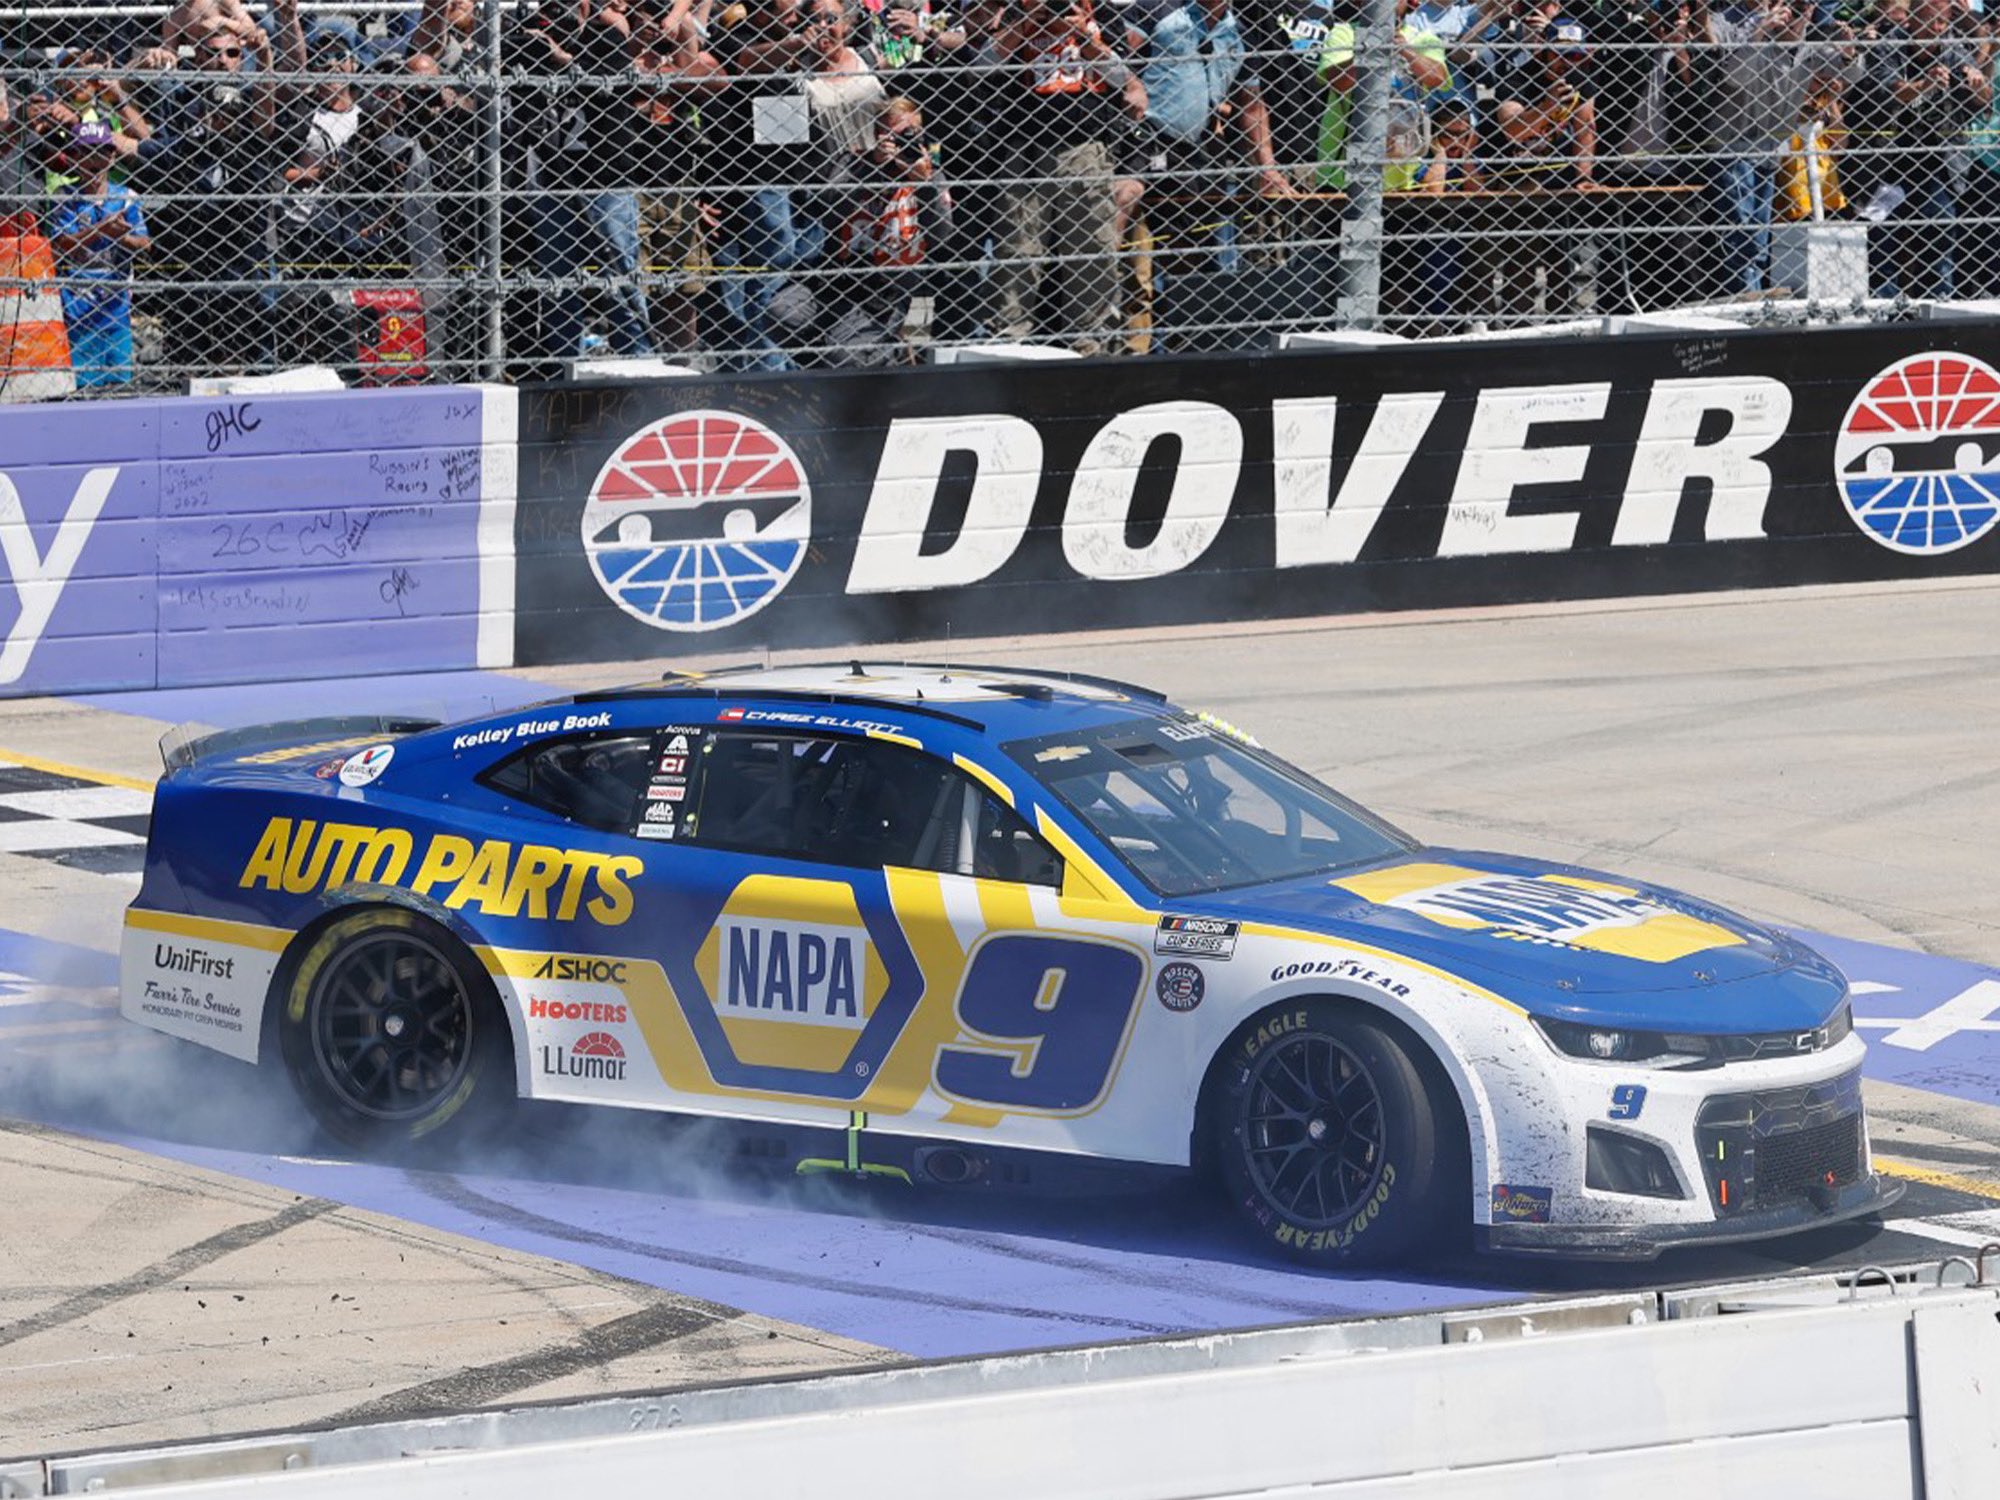
31st in Points – Chase Elliott
| Category | Statistic | 2023 Rank | ªRank Thru 10 Races |
| Avg. Fin.¹ | 15.5 | T11th of 38 | T218th of 851 |
| Completed Laps%¹ | 90.67% | 35th of 38 | 638th of 851 |
| Laps in Top15%¹ | 38.1% | 19th of 38 | 377th of 806‡ |
| Avg. Driver Rating¹ | 76.83 | 15th of 38 | 315th of 806‡ |
| Wins | 0 | T8th of 51 | T142nd of 1074 |
| Poles | 0 | T7th of 51 | T128th of 1074 |
| Top 2’s | 1 | T7th of 51 | T106th of 1074 |
| Top 3’s | 1 | T10th of 51 | T162nd of 1074 |
| Top 5’s | 1 | T15th of 51 | T254th of 1074 |
| Top 10’s | 2 | T20th of 51 | T342nd of 1074 |
| DNF’s¹ | 1 | T11th of 38 | T254th of 851 |
| Stage Wins | 1 | T5th of 51 | T39th of 351* |
| Stage T10s | 4 | T20th of 51 | T129th of 351* |
| Stage Pts | 24 | T20th of 51 | T116th of 351* |
| Playoff Pts² | 1 | T9th of 51 | T67th of 351* |
ªSince Playoffs started in 2004
¹Ranks of drivers to start 40% of races thru 10 races
²Earned from races only, does not reflect penalties
*Stage racing started in 2017
‡Loop Data started in 2005, max Driver Rating is 150.0
- Notable Streaks this year
- 2 straight Top 10 finishes (of races he ran)
- 2022/23 Small Track Stats (Avg. Fin. and Driver Rating rank among drivers with 1+ Small Track start, 45 drivers)
- 5 Races, Avg. Finish 12.6(10th), 79.66% of Laps ran in Top15, Avg. Driver Rating 102.66(1st), Best 1st, Worst 28th, Laps Completed 99.87%, Led 8.67% of laps he ran, 1 Win, 0 Poles, 2 Top 3’s, 2 Top 5’s, 2 Top 10’s, 3 Top 15’s, 2 Finishes out of Top 20, 0 DNF’s, 0 Stage Wins, 4.4 Stage Pts Per Stage
- Dover Statistics
- 2022 Dover Race
- Finished 1st, Started 4th, Led 73 laps (18.25%), Finished 2nd in Stage 1 and 10th in Stage 2, ran 399 Laps in Top15 (99.75% of laps he ran), had 132.9 Driver Rating (ranked 1st)
- Notable Dover Statistics (Ranks are of drivers with 1+ start this year)
- 12 Races
- 9.75 Avg. Finish (Ranks 3rd)
- Best Finish: 1st, Worst: 39th
- Completed 84.95% of laps (% ranks 33rd)
- 93.9% of Laps ran in Top15 (% ranks 1st)
- 97.1 Average Driver Rating (Ranks 6th)
- Led 10.01% of laps he’s run (% ranks 5th)
- 2 Wins, 16.67% (% ranks 2nd)
- 6 Top 3’s, 50.0% (% ranks 1st)
- 9 Top 5’s, 75.0% (% ranks 1st)
- 10 Top 15’s, 83.33% (% ranks 3rd)
- 2 finishes outside Top 20, 16.67% (% ranks T5th)
- 2 DNF’s, 16.67% (% ranks T30th)
- 0 Stage Wins
- 14 Stage T10’s, 70.0% (% ranks 4th)
- 3.65 Stage Pts Per Stage (Ranks 7th)
Chase Elliott is notable because of his race at Dover last year. Last week in Talladega Elliott won Stage 1, finished 2nd in Stage 2 and finished 12th at the end of the race. This was Elliott’s first Stage Win of the year and he now has 24 Stage Pts in 4 races. His Avg. Finish is a decent 15.5 as well, but his Avg. Driver Rating of 76.83 ranks 15th this year and his 38.1 Laps in Top15% is even worse at 19th best this year. On the year he has 2 Top 10 finishes, which is as many Top 10’s as he’s had in his last 5 Small track races as well. In these 5 races he has just the 10th best Avg. Finish at 12.6, but his 102.66 Avg. Driver Rating is the best of any driver over the last 6 Small track races. Additionally Elliott has ran 80% of his laps in the Top 15, led 8.67% of his laps, 4.4 Stage Pts Per Stage, and 1 Win with 2 Top 3’s. That win came here at Dover last year where Elliott ran all but 1 lap in the Top 15, led 73 laps, and had the best Driver Rating at 132.9. This was Elliott’s 2nd Win, 6th Top 3, and 9th Top 5 here in 12 starts. In fact his 50.0 Top 3% and 75.0 Top 5% rank 1st among all active drivers. His finishes give him a 9.75 Avg. Finish here (ranks 3rd) and the way he’s ran gives him a 97.1 Avg. Driver Rating (ranks 6th). This year will be a challenge for Elliott at Dover with his bad leg but I still think he does a decent job. Based on this and his stats above I see Elliott running Top 15 most the race and finishing between 5th and 10th.