
1st in Points – Martin Truex Jr.
| Category | Statistic | 2023 Rank | ªRank Thru 21 Races |
| Avg. Fin.¹ | 11.9 | 2nd of 35 | T73rd of 811 |
| Completed Laps%¹ | 99.68% | 1st of 35 | 32nd of 811 |
| Laps in Top15%¹ | 78.46% | 3rd of 35 | 58th of 769‡ |
| Avg. Driver Rating¹ | 100.71 | 2nd of 35 | 61st of 769‡ |
| Wins | 3 | T2nd of 59 | T30th of 1274 |
| Poles | 1 | T5th of 59 | T82nd of 1274 |
| Top 2’s | 4 | T3rd of 59 | T52nd of 1274 |
| Top 3’s | 7 | 1st of 59 | T25th of 1274 |
| Top 5’s | 8 | T2nd of 59 | T54th of 1274 |
| Top 10’s | 11 | T2nd of 59 | T90th of 1274 |
| DNF’s¹ | 1 | T2nd of 35 | T93rd of 811 |
| Stage Wins | 3 | T4th of 59 | T29th of 407* |
| Stage T10s | 29 | 1st of 59 | T15th of 407* |
| Stage Pts | 169 | 2nd of 59 | 21st of 407* |
| Playoff Pts² | 18 | 2nd of 59 | T15th of 407* |
ªSince Playoffs started in 2004
¹Ranks of drivers to start 40% of races thru 21 races
²Earned from races only, does not reflect penalties
*Stage racing started in 2017
‡Loop Data started in 2005, max Driver Rating is 150.0
- Notable Streaks this year
- 2 straight Top 2 finishes (tied longest streak in Cup Series this year)
- 2 straight Top 3 finishes (active streak, longest active streak in Cup Series)
- 2 straight Top 5 finishes (active streak, tied longest active streak in Cup Series)
- 4 straight Top 5 finishes (tied longest streak in Cup Series this year)
- 2 straight Top 10 finishes (active streak, tied longest active streak in Cup Series)
- 2023 Short track Stats (Avg. Fin. and Driver Rating rank among drivers with 1+ Short track start, 39 drivers)
- 2 Races, Avg. Finish 7.0(4th), 77.63% of Laps ran in Top15, Avg. Driver Rating 94.45(6th), Best 3rd, Worst 11th, Laps Completed 100%, Led 7.0% of laps he ran, 0 Wins, 0 Poles, 1 Top 3, 1 Top 5, 1 Top 10, 2 Top 15’s, 0 Finishes out of Top 20, 0 DNF’s, 0 Stage Wins, 1.75 Stage Pts Per Stage
- Richmond Statistics
- 2023 Spring Richmond Race
- Finished 11th, Started 12th, Led 56 laps (14.0%), Finished 4th in Stage 2, ran 375 Laps in Top15 (93.75% of laps he ran), had 103.9 Driver Rating (ranked 6th)
- Notable Richmond Statistics (Ranks are of drivers with 1+ start this year and 1+ start at Richmond, 46 drivers)
- 34 Races
- 15.59 Avg. Finish (Ranks 14th)
- Best Finish: 1st, Worst: 41st
- Completed 97.5% of laps (% ranks T29th)
- 71.52% of Laps ran in Top15 (% ranks 8th)
- 95.44 Average Driver Rating (Ranks 6th)
- Led 10.09% of laps he’s run (% ranks 4th)
- 2 Wins, 8.82% (% ranks 5th)
- 6 Top 3’s, 17.65% (% ranks T8th)
- 9 Top 5’s, 26.47% (% ranks 8th)
- 16 Top 10’s, 47.06% (% ranks T10th)
- 12 finishes outside Top 20, 35.29% (% ranks 19th)
- 4 DNF’s, 11.76% (% ranks 37th)
- 5 Stage Wins, 20.83% (% ranks 2nd)
- 21 Stage T10’s, 87.5% (% ranks T2nd)
- 6.25 Stage Pts Per Stage (Ranks 1st)
– Martin Truex Jr. is notable because of his 2023 season stats
– At Pocono Truex ran 97% of his laps in the Top 15 and came home 3rd
– He now leads the series in 3 2023 Ranks above (99.68 Completed Laps%, 7 Top 3’s, and 29 stage T10’s)
– All 15 of his 2023 Ranks above are 5th or better, with 13 of them being 3rd or better
– He now has the 2nd best Avg. Finish (11.9) and 2nd best Avg. Driver Rating (100.71) this year
– He now has 2 straight Top 3 finishes and earlier this year had 4 straight Top 5’s
– In the 2 Short track races this year he’s finished 3rd and 11th with a 94.45 Avg. Driver Rating (6th best)
– In the 2 races he’s led 7% of his laps and has ran 78% of his laps in the Top 15
– In the Spring race at Richmond Truex led 56 laps, ran 94% of his laps in the Top 15, and had the 6th best Driver Rating (103.9) but finished 11th
– This was his 34th race at Richmond and improved his Avg. Finish to 15.59
– In the 34 races he has 2 Wins and 9 Top 5’s, but also 12 finishes out of the Top 20 with 4 DNF’s
– He’s got 5 Stage Wins here and 6.25 Stage Pts Per Stage (best of active drivers)
Outlook for this weekend
All of these stats above are promising for Truex to have a good run this weekend. However, his Richmond stats are a little lacking and for that reason I see Truex running well all day but falling shy of a win, finishing between 3rd and 12th.
2nd in Points – William Byron
| Category | Statistic | 2023 Rank | ªRank Thru 21 Races |
| Avg. Fin.¹ | 12.14 | 3rd of 35 | 79th of 811 |
| Completed Laps%¹ | 98.5% | 10th of 35 | T137th of 811 |
| Laps in Top15%¹ | 79.0% | 2nd of 35 | 53rd of 769‡ |
| Avg. Driver Rating¹ | 101.67 | 1st of 35 | 53rd of 769‡ |
| Wins | 4 | 1st of 59 | T10th of 1274 |
| Poles | 3 | T1st of 59 | T15th of 1274 |
| Top 2’s | 5 | T1st of 59 | T30th of 1274 |
| Top 3’s | 6 | T2nd of 59 | T42nd of 1274 |
| Top 5’s | 8 | T2nd of 59 | T54th of 1274 |
| Top 10’s | 11 | T2nd of 59 | T90th of 1274 |
| DNF’s¹ | 2 | T11th of 35 | T258th of 811 |
| Stage Wins | 7 | 1st of 59 | T6th of 407* |
| Stage T10s | 28 | T2nd of 59 | T19th of 407* |
| Stage Pts | 202 | 1st of 59 | 10th of 407* |
| Playoff Pts² | 27 | 1st of 59 | 8th of 407* |
ªSince Playoffs started in 2004
¹Ranks of drivers to start 40% of races thru 21 races
²Earned from races only, does not reflect penalties
*Stage racing started in 2017
‡Loop Data started in 2005, max Driver Rating is 150.0
- Notable Streaks this year
- 2 straight Wins (longest streak in Cup Series this year)
- 2 straight Top 2 finishes (tied longest streak in Cup Series this year)
- 3 straight Top 3 finishes (longest streak in Cup Series this year)
- 4 straight Top 5 finishes (tied longest streak in Cup Series this year)
- 6 straight Top 10 finishes
- 2023 Short track Stats (Avg. Fin. and Driver Rating rank among drivers with 1+ Short track start, 39 drivers)
- 2 Races, Avg. Finish 23.5(T27th), 67.0% of Laps ran in Top15, Avg. Driver Rating 94.4(7th), Best 23rd, Worst 24th, Laps Completed 100%, Led 14.63% of laps he ran, 0 Wins, 0 Poles, 0 Top 3’s, 0 Top 5’s, 0 Top 10’s, 0 Top 15’s, 2 Finishes out of Top 20, 0 DNF’s, 1 Stage Win, 4.75 Stage Pts Per Stage
- Richmond Statistics
- 2023 Spring Richmond Race
- Finished 24th, Started 3rd, Led 117 laps (29.25%), Finished 1st in Stage 1 and 3rd in Stage 2, ran 379 Laps in Top15 (94.75% of laps he ran), had 117.6 Driver Rating (ranked 2nd)
- Notable Richmond Statistics (Ranks are of drivers with 1+ start this year and 1+ start at Richmond, 46 drivers)
- 10 Races
- 15.4 Avg. Finish (Ranks 13th)
- Best Finish: 3rd, Worst: 24th
- Completed 99.75% of laps (% ranks 10th)
- 61.85% of Laps ran in Top15 (% ranks 13th)
- 84.76 Average Driver Rating (Ranks 12th)
- Led 5.99% of laps he’s run (% ranks 6th)
- 0 Top 2’s
- 1 Top 3, 10.0% (% ranks 13th)
- 2 Top 10’s, 20.0% (% ranks 20th)
- 5 Top 15’s, 50.0% (% ranks T13th)
- 3 finishes outside Top 20, 30.0% (% ranks 16th)
- 0 DNF’s, 0.00% (% ranks T1st)
- 1 Stage Win, 5.0% (% ranks 7th)
- 2.8 Stage Pts Per Stage (Ranks 9th)
– William Byron is notable because of how he’s performed in 2023
– Byron had the best Driver Rating last week at Pocono, but the late race cautions did not help his cause as he ended up 14th at the finish
– Only 7 of his 15 2023 Ranks above are 1st, but 5 of the 15 are 2nd
– His 4 Wins, 7 Stage Wins, 202 Stage Pts, and 27 Playoffs Pts earned in races are all 10th most or better thru 21 races since 2004
– His longest Top 5 streak this year is 4 races and longest Top 10 streak is 6 races
– In the 2 Short track races this year he’s ran only 67% of his laps in the Top 15, but has a 94.4 Avg. Driver Rating
– He’s gotten 4.75 Stage Pts Per Stage, but has finishes of 23rd and 24th
– In the Spring Richmond race Byron led 29% of the race, ran 95% of his laps in the Top 15 and had the 2nd best Driver Rating (117.6), but finished 24th after a late wreck
– This was his 10th race and worst finish here at Richmond
– In the 10 races he has only 2 Top 10’s with 3 finishes out of the Top 20, but has a 15.4 Avg. Finish
– In his Richmond races he’s ran only 62% of his laps in the Top 15, has an 84.76 Avg. Driver Rating, and only 2.8 Stage Pts Per Stage
Outlook for this weekend
Byron has ran and finished well most of the year, but Short tracks have been good runs followed by bad finishes. Adding this to the struggles he has had here at Richmond make Byron a candidate for a good run but not winning run this weekend. At the end of the race I expect him to be between 6th and 15th.
3rd in Points – Denny Hamlin
| Category | Statistic | 2023 Rank | ªRank Thru 21 Races |
| Avg. Fin.¹ | 12.81 | 4th of 35 | 96th of 811 |
| Completed Laps%¹ | 95.62% | 24th of 35 | T374th of 811 |
| Laps in Top15%¹ | 81.18% | 1st of 35 | 39th of 769‡ |
| Avg. Driver Rating¹ | 96.8 | 3rd of 35 | 90th of 769‡ |
| Wins | 2 | T4th of 59 | T51st of 1274 |
| Poles | 3 | T1st of 59 | T15th of 1274 |
| Top 2’s | 3 | T6th of 59 | T83rd of 1274 |
| Top 3’s | 4 | T6th of 59 | T96th of 1274 |
| Top 5’s | 6 | T5th of 59 | T107th of 1274 |
| Top 10’s | 9 | T8th of 59 | T180th of 1274 |
| DNF’s¹ | 2 | T11th of 35 | T258th of 811 |
| Stage Wins | 4 | 3rd of 59 | T17th of 407* |
| Stage T10s | 26 | 4th of 59 | T29th of 407* |
| Stage Pts | 163 | 3rd of 59 | T25th of 407* |
| Playoff Pts² | 14 | 4th of 59 | T21st of 407* |
ªSince Playoffs started in 2004
¹Ranks of drivers to start 40% of races thru 21 races
²Earned from races only, does not reflect penalties
*Stage racing started in 2017
‡Loop Data started in 2005, max Driver Rating is 150.0
- Notable Streaks this year
- 2 straight Top 5 finishes
- 2 straight Top 10 finishes (active streak, tied longest active streak in Cup Series)
- 2023 Short track Stats (Avg. Fin. and Driver Rating rank among drivers with 1+ Short track start, 39 drivers)
- 2 Races, Avg. Finish 12.0(11th), 90.0% of Laps ran in Top15, Avg. Driver Rating 104.85(2nd), Best 4th, Worst 20th, Laps Completed 100%, Led 13.38% of laps he ran, 0 Wins, 0 Poles, 0 Top 3’s, 1 Top 5, 1 Top 10, 1 Top 15, 0 Finishes out of Top 20, 0 DNF’s, 1 Stage Win, 5.25 Stage Pts Per Stage
- Richmond Statistics
- 2023 Spring Richmond Race
- Finished 20th, Started 11th, Led 71 laps (17.75%), Finished 1st in Stage 2, ran 323 Laps in Top15 (80.75% of laps he ran), had 91.6 Driver Rating (ranked 9th)
- Notable Richmond Statistics (Ranks are of drivers with 1+ start this year and 1+ start at Richmond, 46 drivers)
- 33 Races
- 8.73 Avg. Finish (Ranks 4th)
- Best Finish: 1st, Worst: 24th
- Completed 99.91% of laps (% ranks 6th)
- 85.67% of Laps ran in Top15 (% ranks 3rd)
- 108.66 Average Driver Rating (Ranks 2nd)
- Led 16.7% of laps he’s run (% ranks 1st)
- 4 Wins, 12.12% (% ranks 2nd)
- 3 Poles, 9.09% (% ranks 1st)
- 13 Top 3’s, 39.39% (% ranks 3rd)
- 17 Top 5’s, 51.52% (% ranks 3rd)
- 21 Top 10’s, 63.64% (% ranks 5th)
- 5 finishes outside Top 20, 15.15% (% ranks 10th)
- 0 DNF’s, 0.00% (% ranks T1st)
- 6 Stage Wins, 25.0% (% ranks 1st)
- 4.46 Stage Pts Per Stage (Ranks 3rd)
– Denny Hamlin is notable because he’s 3rd in points
– Hamlin used his patented technique of wrecking drivers to get his 2nd win of the season at Pocono
– He now has 10 of his 15 2023 Ranks above being 5th or better, but only 1 being better than 3rd (81.18 Laps in Top15%, ranks 1st)
– All of his stage stats are 3rd or 4th in the 2023 Ranks above
– His 9 Top 10’s are tied for only 8th most this year
– He’s on a 2 race Top 10 streak, tied for his longest this year
– In the 2 Short track races this year he has the 2nd best Avg. Driver Rating (104.85)
– He’s ran 90% of his laps in the Top 15 on Short tracks this year, has a 12.0 Avg. Finish, 1 Top 5, and has gotten 5.25 Stage Pts Per Stage
– In the Spring Richmond race Hamlin ran 81% of his laps in the Top 15, led 71 laps, had the 9th best Driver Rating (91.6), but finished 20th
– In 33 races at Richmond he has an impressive 8.73 Avg. Finish with 4 Wins and 13 Top 3’s
– His 85.67 Laps in Top15%, 108.66 Avg. Driver Rating, 16.7 Laps Led%, 12.12 Win%, 9.09 Pole%, 39.39 Top 3%, and 51.52 Top 5% all rank 3rd or better among active drivers
– In his 33 races here he has only 5 finishes out of the Top 20 and 0 DNF’s
Outlook for this weekend
Looking at the stats above there is little reason to think that Hamlin won’t run well at Richmond this weekend. The only big blemish is that in the Spring he didn’t finish as well as he ran the entire race. However, that is an anomaly and based on the stats I see Hamlin coming home with possibly another win, finishing between 1st and 7th.
5th in Points – Ross Chastain
| Category | Statistic | 2023 Rank | ªRank Thru 21 Races |
| Avg. Fin.¹ | 15.05 | 10th of 35 | T194th of 811 |
| Completed Laps%¹ | 98.68% | 7th of 35 | 126th of 811 |
| Laps in Top15%¹ | 63.97% | 10th of 35 | 193rd of 769‡ |
| Avg. Driver Rating¹ | 85.5 | 8th of 35 | 225th of 769‡ |
| Wins | 1 | T6th of 59 | T102nd of 1274 |
| Poles | 1 | T5th of 59 | T82nd of 1274 |
| Top 2’s | 2 | 9th of 59 | T121st of 1274 |
| Top 3’s | 4 | T6th of 59 | T96th of 1274 |
| Top 5’s | 6 | T5th of 59 | T107th of 1274 |
| Top 10’s | 8 | T11th of 59 | T226th of 1274 |
| DNF’s¹ | 2 | T11th of 35 | T258th of 811 |
| Stage Wins | 5 | 2nd of 59 | T11th of 407* |
| Stage T10s | 23 | T6th of 59 | T48th of 407* |
| Stage Pts | 148 | 4th of 59 | T39th of 407* |
| Playoff Pts² | 10 | 6th of 59 | T33rd of 407* |
ªSince Playoffs started in 2004
¹Ranks of drivers to start 40% of races thru 21 races
²Earned from races only, does not reflect penalties
*Stage racing started in 2017
‡Loop Data started in 2005, max Driver Rating is 150.0
- Notable Streaks this year
- 2 straight Top 5 finishes
- 2023 Short track Stats (Avg. Fin. and Driver Rating rank among drivers with 1+ Short track start, 39 drivers)
- 2 Races, Avg. Finish 8.0(5th), 77.75% of Laps ran in Top15, Avg. Driver Rating 93.9(9th), Best 3rd, Worst 13th, Laps Completed 100%, Led 5.88% of laps he ran, 0 Wins, 0 Poles, 1 Top 3, 1 Top 5, 1 Top 10, 2 Top 15’s, 0 Finishes out of Top 20, 0 DNF’s, 0 Stage Wins, 4.75 Stage Pts Per Stage
- Richmond Statistics
- 2023 Spring Richmond Race
- Finished 3rd, Started 4th, Led 16 laps (4.0%), Finished 3rd in Stage 1 and 5th in Stage 2, ran 394 Laps in Top15 (98.5% of laps he ran), had 116.2 Driver Rating (ranked 3rd)
- Notable Richmond Statistics (Ranks are of drivers with 1+ start this year and 1+ start at Richmond, 46 drivers)
- 9 Races
- 21.0 Avg. Finish (Ranks 24th)
- Best Finish: 3rd, Worst: 36th
- Completed 95.72% of laps (% ranks 36th)
- 45.39% of Laps ran in Top15 (% ranks 16th)
- 68.77 Average Driver Rating (Ranks 20th)
- Led 2.9% of laps he’s run (% ranks 11th)
- 0 Top 2’s
- 1 Top 3, 11.11% (% ranks T11th)
- 2 Top 10’s, 22.22% (% ranks 18th)
- 3 Top 15’s, 33.33% (% ranks T20th)
- 4 finishes outside Top 20, 44.44% (% ranks 23rd)
- 1 DNF, 11.11% (% ranks 36th)
- 1 Stage Win, 5.56% (% ranks 6th)
- 2.72 Stage Pts Per Stage (Ranks 10th)
– Ross Chastain is notable because of how he ran in the 2023 Richmond Spring race
– Last week Chastain ran only 16% of his laps in the Top 15, but found himself there when it counted as he finished 13th
– He now has a 15.05 Avg. Finish (ranks 10th) and an 85.5 Avg. Driver Rating (ranks 8th)
– Only two of his 2023 Ranks above are 4th or better (5 Stage Wins, ranks 2nd and 148 Stage Pts, ranks 4th)
– His 8 Top 10’s are only tied for 11th most this year, and his 2 Top 2’s are only 9th most
– His longest Top 5/Top 10 streak this year is only 2 races
– In the 2 Short track races this year he’s finished 3rd and 13th while getting 4.75 Stage Pts Per Stage
– In the 2 races he’s ran 78% of his laps in the Top 15, led 6% of his laps, and has a decent 93.9 Avg. Driver Rating
– At the Richmond race this Spring Chastain ran 98.5% of his laps in the Top 15, got 14 Stage Pts, had the 3rd best Driver Rating (116.2), and finished 3rd
– In 9 races at Richmond he has just 2 Top 10’s and 3 Top 15’s to 4 finishes out of the Top 20
– He has a 21.0 Avg. Finish, a 68.77 Avg. Driver Rating, and has ran only 45% of his laps in the Top 15 in his 9 races here
Outlook for this weekend
With the recent struggles for Chastain and his less than stellar stats at Richmond it’s hard to see a good run for him this weekend. However, he ran well (and finished well) here in the Spring and has done decent on Short tracks this year. All of this together I see Chastain getting a finish between 6th and 15th this weekend.
6th in Points – Kyle Busch
| Category | Statistic | 2023 Rank | ªRank Thru 21 Races |
| Avg. Fin.¹ | 12.86 | 5th of 35 | T97th of 811 |
| Completed Laps%¹ | 93.36% | 29th of 35 | T515th of 811 |
| Laps in Top15%¹ | 58.48% | 13th of 35 | 232nd of 769‡ |
| Avg. Driver Rating¹ | 84.45 | 9th of 35 | 236th of 769‡ |
| Wins | 3 | T2nd of 59 | T30th of 1274 |
| Poles | 1 | T5th of 59 | T82nd of 1274 |
| Top 2’s | 5 | T1st of 59 | T30th of 1274 |
| Top 3’s | 5 | T4th of 59 | T68th of 1274 |
| Top 5’s | 7 | 4th of 59 | T76th of 1274 |
| Top 10’s | 12 | 1st of 59 | T63rd of 1274 |
| DNF’s¹ | 4 | T26th of 35 | T588th of 811 |
| Stage Wins | 2 | T9th of 59 | T47th of 407* |
| Stage T10s | 15 | 12th of 59 | T96th of 407* |
| Stage Pts | 90 | 11th of 59 | 77th of 407* |
| Playoff Pts² | 17 | 3rd of 59 | T17th of 407* |
ªSince Playoffs started in 2004
¹Ranks of drivers to start 40% of races thru 21 races
²Earned from races only, does not reflect penalties
*Stage racing started in 2017
‡Loop Data started in 2005, max Driver Rating is 150.0
- Notable Streaks this year
- 2 straight Top 2 finishes (tied longest streak in Cup Series this year)
- 7 straight Top 10 finishes (longest streak in Cup Series this year)
- 2023 Short track Stats (Avg. Fin. and Driver Rating rank among drivers with 1+ Short track start, 39 drivers)
- 2 Races, Avg. Finish 17.5(20th), 39.75% of Laps ran in Top15, Avg. Driver Rating 64.8(21st), Best 14th, Worst 21st, Laps Completed 100%, Led 0.13% of laps he ran, 0 Wins, 0 Poles, 0 Top 3’s, 0 Top 5’s, 0 Top 10’s, 1 Top 15, 1 Finish out of Top 20, 0 DNF’s, 0 Stage Wins, 0 Stage T10’s
- Richmond Statistics
- 2023 Spring Richmond Race
- Finished 14th, Started 2nd, Led 1 laps (0.25%), got 0 Stage T10’s, ran 254 Laps in Top15 (63.5% of laps he ran), had 78.5 Driver Rating (ranked 14th)
- Notable Richmond Statistics (Ranks are of drivers with 1+ start this year and 1+ start at Richmond, 46 drivers)
- 35 Races
- 7.2 Avg. Finish (Ranks 3rd)
- Best Finish: 1st, Worst: 24th
- Completed 99.99% of laps (% ranks 3rd)
- 88.1% of Laps ran in Top15 (% ranks 2nd)
- 108.11 Average Driver Rating (Ranks 3rd)
- Led 10.91% of laps he’s run (% ranks 3rd)
- 6 Wins, 17.14% (% ranks 1st)
- 13 Top 2’s, 37.14% (% ranks 2nd)
- 18 Top 5’s, 51.43% (% ranks 4th)
- 27 Top 10’s, 77.14% (% ranks 3rd)
- 1 finish outside Top 20, 2.86% (% ranks 4th)
- 0 DNF’s, 0.00% (% ranks T1st)
- 3 Stage Wins, 12.5% (% ranks 4th)
- 3.25 Stage Pts Per Stage (Ranks 7th)
– Kyle Busch is notable because of his career Richmond stats
– Busch struggled last week as he ran just 20% of his laps in the Top 15 and then finished 21st
– This race now has his Avg. Finish at 12.86 and his Avg. Driver Rating at 84.45
– His best stats are his 5 Top 2’s, 12 Top 10’s, 3 Wins, and 17 Playoff Pts as they all rank 3rd or better in the 2023 Ranks above
– His worst stats are his 93.36 Completed Laps%, 4 DNF’s, 58.48 Laps inTop15%, 15 Stage T10’s, and 90 Stage Pts as they all rank worse than 10th in the 2023 Ranks above
– Before the last 2 weeks he had a 7 race Top 10 streak
– In 2 races this year on Short tracks he has a pathetic 64.8 Avg. Driver Rating, and a 17.5 Avg. Finish with 0 Top 10’s
– In the 2 races he’s ran only 40% of his laps in the Top 15 and has 0 Stage Pts
– In the Spring Richmond race Busch ran 63.5% of his laps in the Top 15, had the 14th best Driver Rating (78.5), and finished 14th
– This was one of only 8 race finishes out of the Top 10 for him at Richmond in his 33 races
– At Richmond he has a 7.2 Avg. Finish, an 88.1 Laps in Top15%, and a 108.11 Avg. Driver Rating
– His worst Richmond rank above is only 7th and his 17.14 Win% ranks 1st with his 37.14 Top2% ranking 2nd
Outlook for this weekend
Busch’s Richmond stats suggest this will be a great weekend for him, but the rest of his stats suggest more of a struggle. This weekend I think he doesn’t struggle as much as he had in some of the season, but I still only see him finishing between 8th and 15th.
7th in Points – Kyle Larson
| Category | Statistic | 2023 Rank | ªRank Thru 21 Races |
| Avg. Fin.¹ | 15.81 | 15th of 35 | T240th of 811 |
| Completed Laps%¹ | 94.62% | 27th of 35 | T436th of 811 |
| Laps in Top15%¹ | 72.59% | 6th of 35 | 116th of 769‡ |
| Avg. Driver Rating¹ | 93.55 | 4th of 35 | 125th of 769‡ |
| Wins | 2 | T4th of 59 | T51st of 1274 |
| Poles | 2 | T3rd of 59 | T38th of 1274 |
| Top 2’s | 4 | T3rd of 59 | T52nd of 1274 |
| Top 3’s | 5 | T4th of 59 | T68th of 1274 |
| Top 5’s | 9 | 1st of 59 | T32nd of 1274 |
| Top 10’s | 10 | T5th of 59 | T143rd of 1274 |
| DNF’s¹ | 6 | T33rd of 35 | T745th of 811 |
| Stage Wins | 3 | T4th of 59 | T29th of 407* |
| Stage T10s | 24 | 5th of 59 | T41st of 407* |
| Stage Pts | 143 | 6th of 59 | T45th of 407* |
| Playoff Pts² | 13 | 5th of 59 | T25th of 407* |
ªSince Playoffs started in 2004
¹Ranks of drivers to start 40% of races thru 21 races
²Earned from races only, does not reflect penalties
*Stage racing started in 2017
‡Loop Data started in 2005, max Driver Rating is 150.0
- Notable Streaks this year
- 2 straight Top 5 finishes
- 4 straight Top 10 finishes
- 2023 Short track Stats (Avg. Fin. and Driver Rating rank among drivers with 1+ Short track start, 39 drivers)
- 2 Races, Avg. Finish 1.0(1st), 99.13% of Laps ran in Top15, Avg. Driver Rating 122.65(1st), Best 1st, Worst 1st, Laps Completed 100%, Led 15.38% of laps he ran, 2 Wins, 0 Poles, 2 Top 3’s, 2 Top 5’s, 2 Top 10’s, 2 Top 15’s, 0 Finishes out of Top 20, 0 DNF’s, 0 Stage Wins, 3.75 Stage Pts Per Stage
- Richmond Statistics
- 2023 Spring Richmond Race
- Finished 1st, Started 9th, Led 93 laps (23.25%), Finished 2nd in Stage 1 and 8th in Stage 2, ran 400 Laps in Top15 (100% of laps he ran), had 130.3 Driver Rating (ranked 1st)
- Notable Richmond Statistics (Ranks are of drivers with 1+ start this year and 1+ start at Richmond, 46 drivers)
- 17 Races
- 10.82 Avg. Finish (Ranks 7th)
- Best Finish: 1st, Worst: 37th
- Completed 95.92% of laps (% ranks 35th)
- 78.65% of Laps ran in Top15 (% ranks 6th)
- 91.69 Average Driver Rating (Ranks 8th)
- Led 2.83% of laps he’s run (% ranks 12th)
- 2 Wins, 11.76% (% ranks 3rd)
- 3 Top 2’s, 17.65% (% ranks 5th)
- 8 Top 10’s, 47.06% (% ranks T10th)
- 14 Top 15’s, 82.35% (% ranks 4th)
- 1 finish outside Top 20, 5.88% (% ranks 5th)
- 1 DNF, 5.88% (% ranks 34th)
- 0 Stage Wins
- 13 Stage T10’s, 59.09% (% ranks 5th)
- 3.5 Stage Pts Per Stage (Ranks 6th)
– Kyle Larson is notable because of his stellar 2023 Short track stats
– Larson was in prime position to get his 3rd win of the year until Denny Hamlin walled him on the 2nd to last restart relegating him to a 20th place finish
– He now has a 15.81 Avg. Finish (ranks 15th), a 94.62 Completed Laps% (ranks 27th), and 6 DNF’s (ranks T33rd)
– The rest of his 2023 Ranks are 6th or better
– His 9 Top 5’s are most this year, but are his only 2023 Rank above better than 3rd
– He has won both Short track races this year with an Avg. Driver Rating of 122.65
– In the 2 races he’s ran 99.13% of his laps in the Top 15, led 15.38% of his laps, and has gotten 3.75 Stage Pts Per Stage
– In the Richmond race this Spring Larson led 93 laps, got 12 Stage Pts, ran all 400 laps in the Top 15, had the best Driver Rating (130.3), and won the race
– This was his 2nd win and 8th Top 10 at Richmond in 17 starts
– He has only 1 finish out of the Top 20 here, and that finish was a DNF
– Overall at Richmond he has a 10.82 Avg. Finish, a 91.69 Avg. Driver Rating, and has ran 78.65% of his laps in the Top 15
Outlook for this weekend
Larson’s 2023 stats tell the story of his season, good runs but not so good finishes. The biggest bright spots for Larson are that he’s won both Short track races this year and has run well at Richmond in his career. This weekend, as long as he stays out of trouble, I see Larson coming home with a solid Top 10 between 1st and 8th.
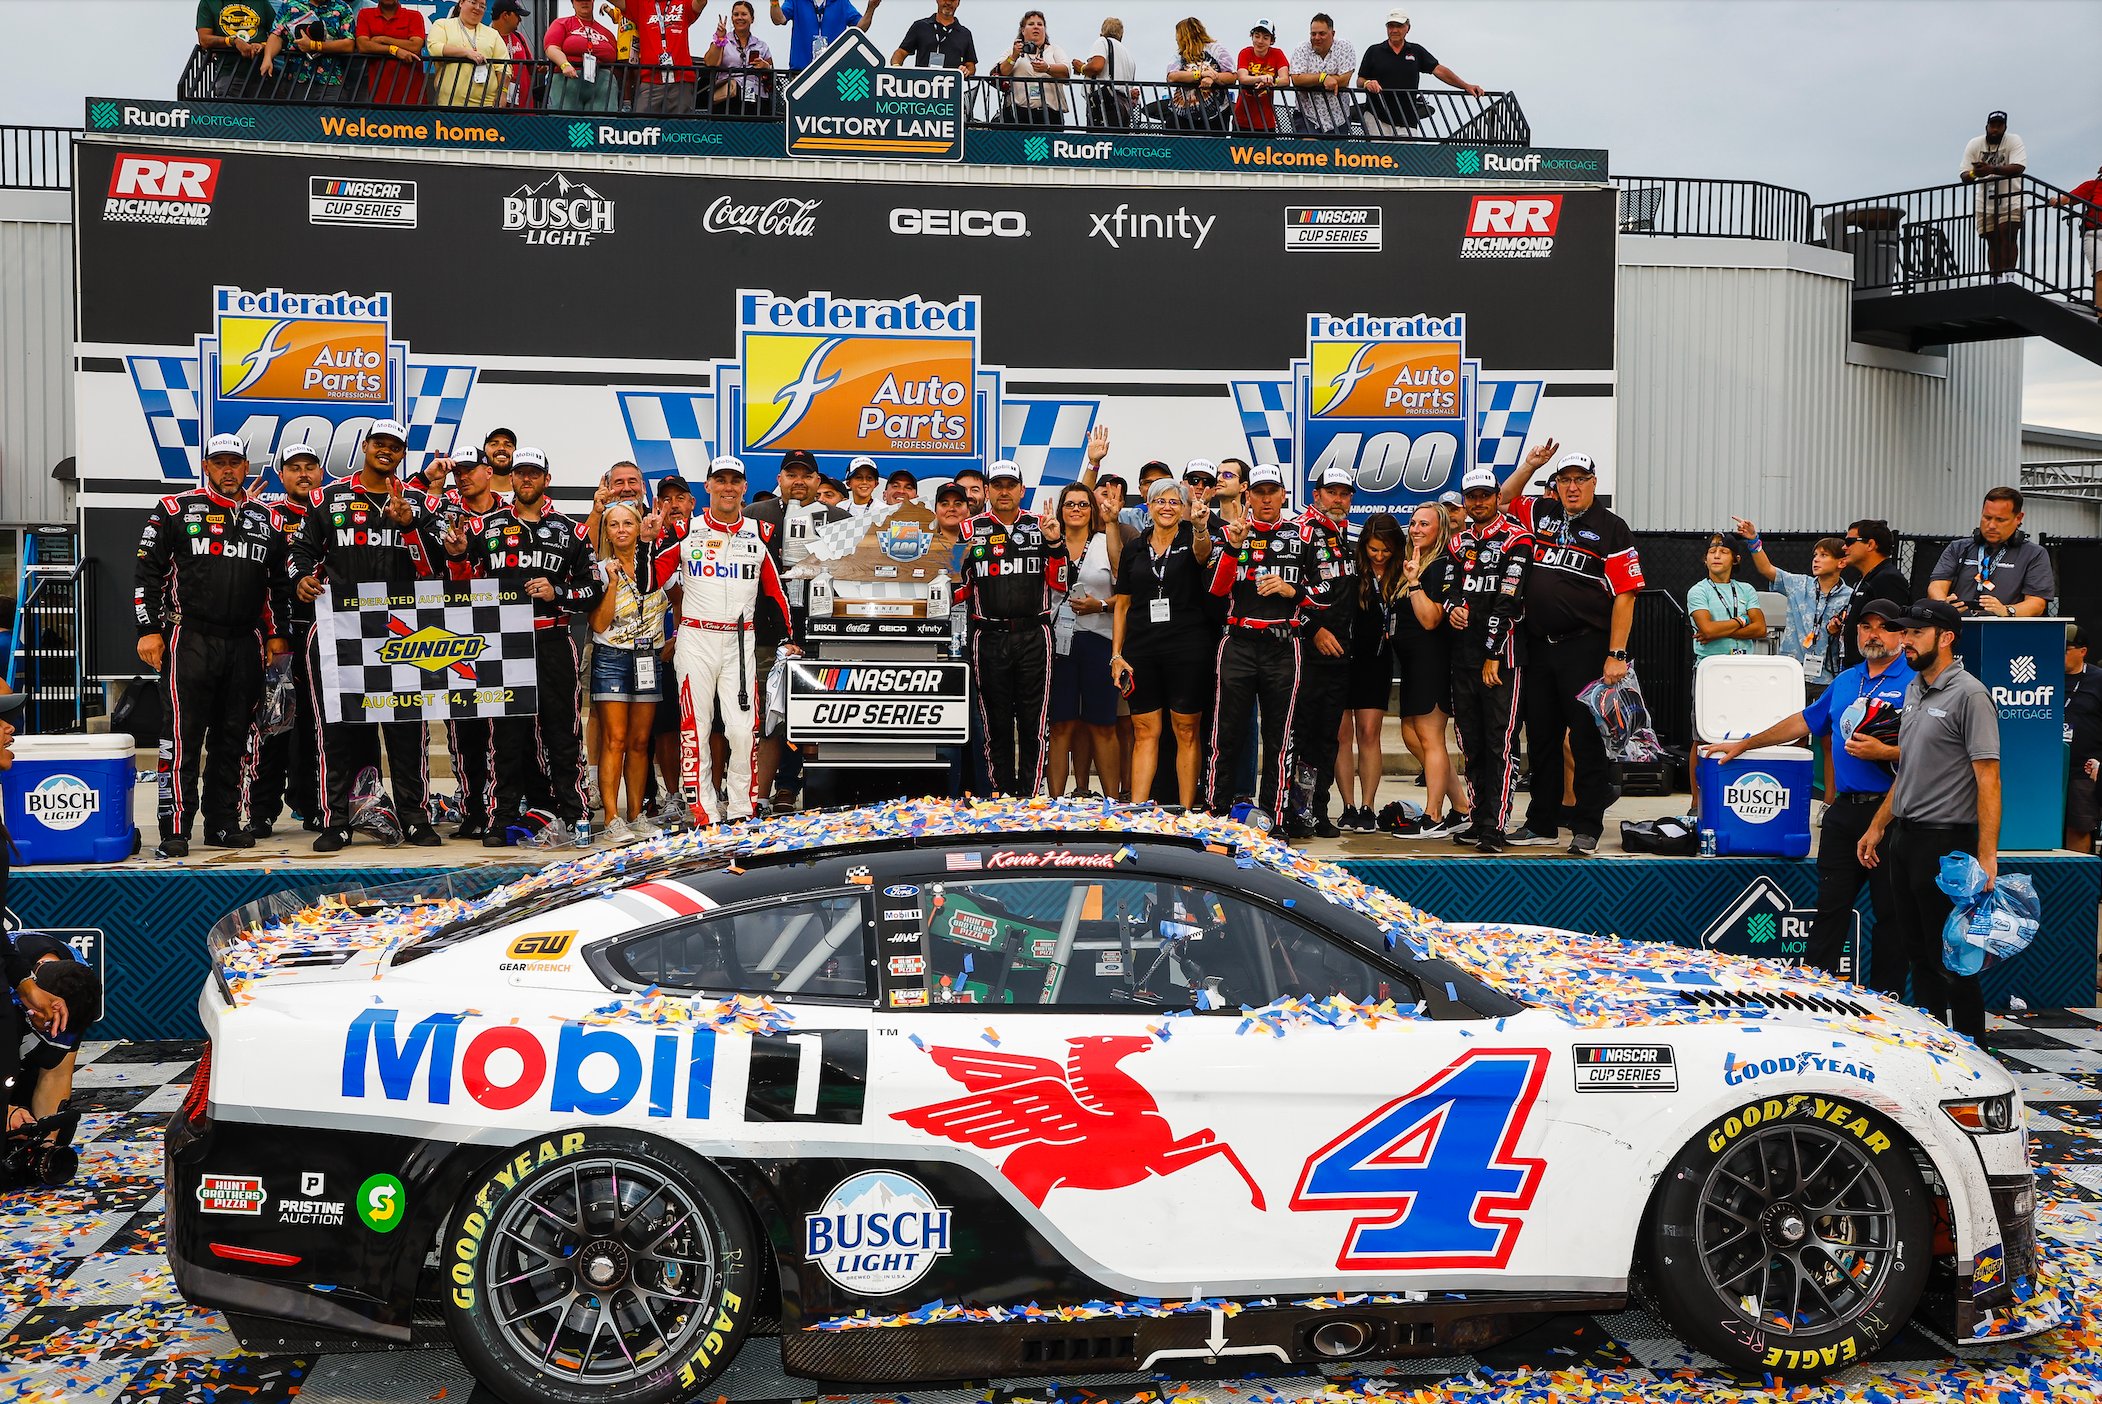
8th in Points – Kevin Harvick
| Category | Statistic | 2023 Rank | ªRank Thru 21 Races |
| Avg. Fin.¹ | 13.67 | 6th of 35 | T136th of 811 |
| Completed Laps%¹ | 98.57% | 9th of 35 | 133rd of 811 |
| Laps in Top15%¹ | 71.54% | 7th of 35 | 127th of 769‡ |
| Avg. Driver Rating¹ | 83.35 | 10th of 35 | 249th of 769‡ |
| Wins | 0 | T13th of 59 | T228th of 1274 |
| Poles | 0 | T12th of 59 | T214th of 1274 |
| Top 2’s | 1 | T10th of 59 | T188th of 1274 |
| Top 3’s | 1 | T13th of 59 | T274th of 1274 |
| Top 5’s | 6 | T5th of 59 | T107th of 1274 |
| Top 10’s | 9 | T8th of 59 | T180th of 1274 |
| DNF’s¹ | 1 | T2nd of 35 | T93rd of 811 |
| Stage Wins | 1 | T12th of 59 | T73rd of 407* |
| Stage T10s | 22 | 8th of 59 | T59th of 407* |
| Stage Pts | 106 | 10th of 59 | 71st of 407* |
| Playoff Pts² | 1 | T14th of 59 | T97th of 407* |
ªSince Playoffs started in 2004
¹Ranks of drivers to start 40% of races thru 21 races
²Earned from races only, does not reflect penalties
*Stage racing started in 2017
‡Loop Data started in 2005, max Driver Rating is 150.0
- Notable Streaks this year
- 2 straight Top 5 finishes (active streak, tied longest active streak in Cup Series)
- 2 straight Top 10 finishes (active streak, tied longest active streak in Cup Series)
- 3 straight Top 10 finishes
- 2023 Short track Stats (Avg. Fin. and Driver Rating rank among drivers with 1+ Short track start, 39 drivers)
- 2 Races, Avg. Finish 12.5(T12th), 91.13% of Laps ran in Top15, Avg. Driver Rating 102.1(4th), Best 5th, Worst 20th, Laps Completed 100%, Led 2.5% of laps he ran, 0 Wins, 0 Poles, 0 Top 3’s, 1 Top 5, 1 Top 10, 1 Top 15, 0 Finishes out of Top 20, 0 DNF’s, 1 Stage Win, 6.0 Stage Pts Per Stage
- Richmond Statistics
- 2023 Spring Richmond Race
- Finished 5th, Started 10th, Led 0 laps, Finished 4th in Stage 1 and 9th in Stage 2, ran 383 Laps in Top15 (95.75% of laps he ran), had 102.8 Driver Rating (ranked 7th)
- Notable Richmond Statistics (Ranks are of drivers with 1+ start this year and 1+ start at Richmond, 46 drivers)
- 44 Races
- 9.55 Avg. Finish (Ranks 5th)
- Best Finish: 1st, Worst: 40th
- Completed 99.31% of laps (% ranks 22nd)
- 93.09% of Laps ran in Top15 (% ranks 1st)
- 109.43 Average Driver Rating (Ranks 1st)
- Led 7.06% of laps he’s run (% ranks 5th)
- 4 Wins, 9.09% (% ranks 4th)
- 8 Top 2’s, 18.18% (% ranks 4th)
- 18 Top 5’s, 40.91% (% ranks 6th)
- 30 Top 10’s, 68.18% (% ranks 4th)
- 4 finishes outside Top 20, 9.09% (% ranks 7th)
- 0 DNF’s, 0.00% (% ranks T1st)
- 0 Stage Wins
- 22 Stage T10’s, 91.67% (% ranks 1st)
- 4.25 Stage Pts Per Stage (Ranks 5th)
– Kevin Harvick is notable because of his stats in his 44 career Richmond starts
– At Pocono Harvick had one of his better finishes of the year, coming home 4th
– His best 2023 Ranks above are his 1 DNF (ranks T2nd) and his 6 Top 5’s (ranks T5th)
– He has the same amount of DNF’s as Top 3’s and Stage Wins (1)
– 8 of his 15 2023 Ranks above are 10th or worse
– He is on a 2 race Top 5 streak, tied longest active streak in Cup Series
– In the 2 Short track races this year he has a 5th place finish and 20th place finish
– In the races he has ran 91% of his laps in the Top 15, has a 102.1 Avg. Driver Rating, 1 Stage Win, and has amassed 6.0 Stage Pts Per Stage
– At Richmond in the Spring Harvick finished 5th with the 7th best Driver Rating (102.8) after running 96% of his laps in the Top 15 and getting 9 Stage Pts
– He’s ran 44 races here at Richmond and has a 9.55 Avg. Finish with 4 Wins, 18 Top 5’s, and 30 Top 10’s
– His 93.09 Laps in Top15% and 109.43 Avg. Driver Rating here are best among active drivers
– He has never had a DNF at Richmond, but has also never won a Stage despite having 22 Stage T10’s in 24 stages
Outlook for this weekend
Harvick has not been awful this year, but hasn’t been good either. However, at Richmond he’s always been good and that includes his race from earlier this year. At any other track I wouldn’t expect much based on this year, but since this is Richmond I think Harvick has a good run and finishes between 1st and 7th.
31st in Points – Chase Briscoe
| Category | Statistic | 2023 Rank | ªRank Thru 21 Races |
| Avg. Fin.¹ | 20.43 | 25th of 35 | T432nd of 811 |
| Completed Laps%¹ | 97.86% | 13th of 35 | T177th of 811 |
| Laps in Top15%¹ | 30.36% | 22nd of 35 | 419th of 769‡ |
| Avg. Driver Rating¹ | 60.56 | 27th of 35 | 493rd of 769‡ |
| Wins | 0 | T13th of 59 | T228th of 1274 |
| Poles | 0 | T12th of 59 | T214th of 1274 |
| Top 2’s | 0 | T19th of 59 | T339th of 1274 |
| Top 3’s | 0 | T23rd of 59 | T411th of 1274 |
| Top 5’s | 3 | T15th of 59 | T252nd of 1274 |
| Top 10’s | 5 | T20th of 59 | T349th of 1274 |
| DNF’s¹ | 1 | T2nd of 35 | T93rd of 811 |
| Stage Wins | 0 | T18th of 59 | T105th of 407* |
| Stage T10s | 8 | T21st of 59 | T131st of 407* |
| Stage Pts | 29 | 26th of 59 | T141st of 407* |
| Playoff Pts² | 0 | T20th of 59 | T121st of 407* |
ªSince Playoffs started in 2004
¹Ranks of drivers to start 40% of races thru 21 races
²Earned from races only, does not reflect penalties
*Stage racing started in 2017
‡Loop Data started in 2005, max Driver Rating is 150.0
- Notable Streaks this year
- 3 straight Top 5 finishes
- 2023 Short track Stats (Avg. Fin. and Driver Rating rank among drivers with 1+ Short track start, 39 drivers)
- 2 Races, Avg. Finish 8.5(6th), 88.0% of Laps ran in Top15, Avg. Driver Rating 103.65(3rd), Best 5th, Worst 12th, Laps Completed 100%, Led 13.63% of laps he ran, 0 Wins, 0 Poles, 0 Top 3’s, 1 Top 5, 1 Top 10, 2 Top 15’s, 0 Finishes out of Top 20, 0 DNF’s, 0 Stage Wins, 4.0 Stage Pts Per Stage
- Richmond Statistics
- 2023 Spring Richmond Race
- Finished 12th, Started 19th, Led 0 laps, Finished 10th in Stage 1, ran 310 Laps in Top15 (77.5% of laps he ran), had 81.5 Driver Rating (ranked 12th)
- Notable Richmond Statistics (Ranks are of drivers with 1+ start this year and 1+ start at Richmond, 46 drivers)
- 5 Races
- 16.8 Avg. Finish (Ranks 17th)
- Best Finish: 11th, Worst: 23rd
- Completed 99.65% of laps (% ranks 12th)
- 40.44% of Laps ran in Top15 (% ranks 20th)
- 70.78 Average Driver Rating (Ranks 17th)
- Led 0.00% of laps he’s run
- 0 Top 10’s
- 2 Top 15’s, 40.0% (% ranks 19th)
- 2 finishes outside Top 20, 40.0% (% ranks 21st)
- 0 DNF’s, 0.00% (% ranks T1st)
- 0 Stage Wins
- 2 Stage T10’s, 20.0% (% ranks 19th)
– Chase Briscoe is notable because of his 2023 Short track stats
– Briscoe ran only 9% of his laps in the Top 15 last week at Pocono and finished 29th after getting wrecked by Ty Dillon
– His Avg. Finish is now 20.43 (25th best) and his Avg. Driver Rating is 60.56 (27th best)
– He has just 3 Top 5’s, 5 Top 10’s, and only 29 Stage Pts this year
– His only 2023 Rank above that’s better than 12th is his 1 DNF
– His 3 Top 5’s came in a 3 race stretch earlier this year
– In the 2 Short track races this year he’s ran 88% of his laps in the Top 15, led 13.63% of his laps, and has gotten 4 Stage Pts Per Stage
– In the 2 races he’s finished 5th and 12th, and he has the 3rd best Avg. Driver Rating at 103.65
– The Spring Richmond race saw Briscoe run 77.5% of his laps in the Top 15, have the 12th best Driver Rating (81.5), and finish 12th
– This was his 5th race at Richmond and his 2nd best finish here
– He has 2 Top 15’s, 2 finishes out of the Top 20, and a 16.8 Avg. Finish here
– Overall he’s ran 40% of his laps in the Top 15, has a 70.78 Avg. Driver Rating, and only 2 Stage T10’s in 10 stages
Outlook for this weekend
Briscoe, like all of SHR other than Harvick, has sucked this year. The same goes for Briscoe in his career at Richmond as well. In fact his only bright spot is his Short track stats this year, which most of came at Martinsville. For that reason I see another struggle coming this weekend for Briscoe this weekend as he finishes between 10th and 25th, with a high possibility of it being out of the Top 15.