
1st in Points – John Hunter Nemechek
| Category | Statistic | 2023 Rank | ªRank Thru 16 Races |
| Avg. Fin.¹ | 8.19 | 2nd of 34 | 13th of 274 |
| Completed Laps%¹ | 98.35% | 9th of 34 | 50th of 274 |
| Laps in Top15%¹ | 87.98% | 1st of 34 | 20th of 274 |
| Avg. Driver Rating¹ | 110.2 | 1st of 34 | 10th of 274‡ |
| Wins | 2 | T2nd of 84 | T14th of 646 |
| Poles | 1 | T3rd of 84 | T17th of 646 |
| Top 2’s | 6 | 1st of 84 | T4th of 646 |
| Top 3’s | 6 | 2nd of 84 | T13th of 646 |
| Top 5’s | 8 | 3rd of 84 | T15th of 646 |
| Top 10’s | 13 | T1st of 84 | T4th of 646 |
| DNF’s¹ | 1 | T5th of 34 | T34th of 274 |
| Stage Wins | 4 | T2nd of 84 | T14th of 561* |
| Stage T10s | 24 | 1st of 84 | T12th of 561* |
| Stage Pts | 169 | 1st of 84 | 11th of 561* |
| Playoff Pts² | 14 | 3rd of 84 | T13th of 561* |
ªSince Playoffs started in 2016
¹Ranks of drivers to start 45% of races thru 16 races
²Earned from races only, does not reflect penalties
*Stage racing started in 2017
‡Max Driver Rating is 150.0
- Notable Streaks this year
- 2 straight Top 2 finishes
- 3 straight Top 5 finishes
- 5 straight Top 10 finishes
- 2 straight Top 10 finishes (active streak)
- 2023 Superspeedway Stats (Avg. Fin. and Driver Rating rank among drivers with 1+ Superspeedway start, 49 drivers)
- 3 Races, Avg. Finish 14.0(12th), 88.35% of Laps ran in Top15, Avg. Driver Rating 87.03(9th), Best 2nd, Worst 32nd, Laps Completed 90.22%, Led 4.88% of laps he ran, 0 Wins, 0 Poles, 1 Top 3, 1 Top 5, 2 Top 10’s, 2 Top 15’s, 1 Finish out of Top 20, 1 DNF, 0 Stage Wins, 2.17 Stage Pts Per Stage
- Atlanta Statistics
- 2023 Spring Atlanta race
- Finished 8th, Started 2nd, Led 10 laps (6.13%), Finished 3rd in Stage 1, ran 141 Laps in Top15 (86.5% of laps he ran), had 87.6 Driver Rating (ranked 10th)
- Notable Atlanta Statistics (Ranks are of drivers with 1+ start this year and 1+ start at Atlanta, 64 drivers)
- 3 Races
- 10.67 Avg. Finish (Ranks 14th)
- Best Finish: 4th, Worst: 20th
- Completed 99.8% of laps (% ranks 19th)
- 89.55% of Laps ran in Top15 (% ranks 10th)
- 92.8 Average Driver Rating (Ranks 13th)
- Led 2.05% of laps he’s run (% ranks 12th)
- 0 Top 3’s
- 1 Top 5, 33.33% (% ranks T12th)
- 2 Top 10’s, 66.67% (% ranks T9th)
- 0 finishes outside Top 20, 0.00% (% ranks T1st)
- 0 DNF’s, 0.00% (% ranks T1st)
- 0 Stage Wins
- 3 Stage T10’s, 50.0% (% ranks T14th)
John Hunter Nemechek is notable because of his 2023 season stats. At Chicago Nemechek ran 24 of the 25 laps in 2nd place, including the last lap. This was Nemechek’s series leading 6th Top 2, 3rd best 8th Top 5, and tied for series best 13th Top 10. In addition he leads the series in the following categories: Laps in Top15% (87.98%), Avg. Driver Rating (110.2), Stage T10’s (24), and Stage Pts (169). Furthermore Nemechek is on a 2 race Top 10 streak and has finished in the Top 10 in 2 of the 3 Superspeedway races this year. In total he has a 14.0 Avg. Finish in the 3 races with a best finish of 2nd and worst of 32nd, a DNF at Talladega. Moreover he’s ran 88.35% of his laps in the Top 15, led 4.88% of his laps, has an 87.03 Avg. Driver Rating, and has gotten 2.17 Stage Pts Per Stage. Earlier this year at Atlanta Nemechek finished 8th, led 10 laps, ran 86.5% of his laps in the Top 15, and had the 10th best Driver Rating at 87.6. This was Nemechek’s 3rd race at Atlanta and his 2nd Top 10 finish in those 3 races with 1 of those being a Top 5. In addition he’s ran 89.55% of his laps in the Top 15, has a 92.8 Avg. Driver Rating, and 3 Stage T10’s; but 2 of these 3 races were at the non-Superspeedway Atlanta so the Atlanta stats aren’t too telling. With that said I do think he runs well this weekend and comes home with a Top 10 finish or a DNF.
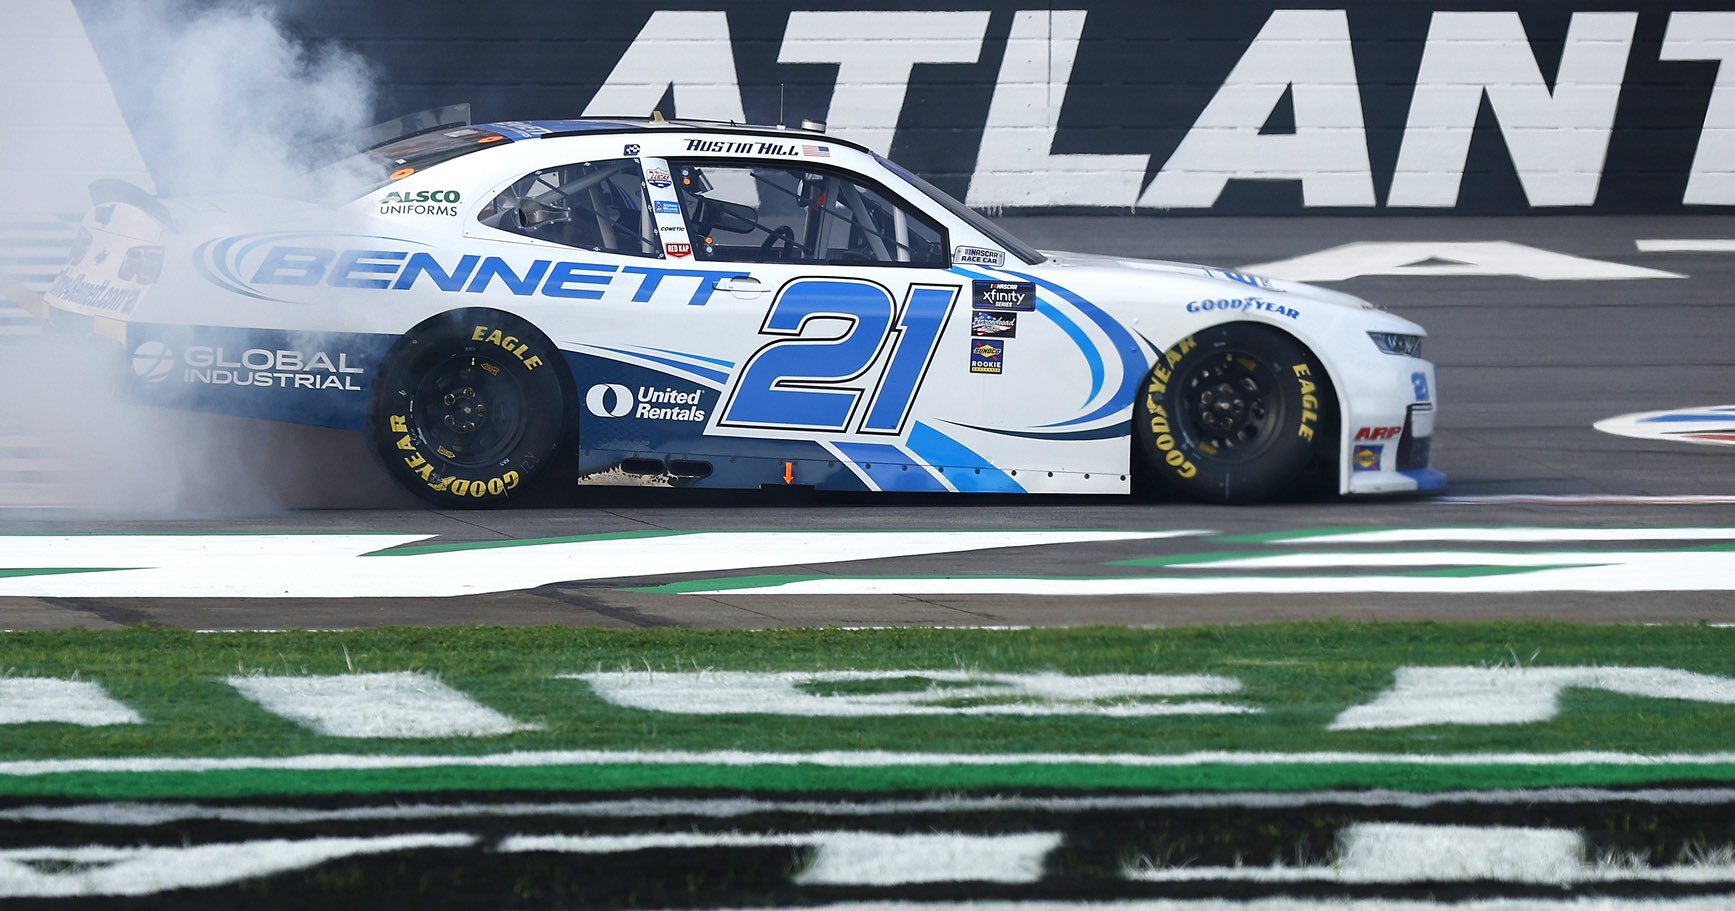
2nd in Points – Austin Hill
| Category | Statistic | 2023 Rank | ªRank Thru 16 Races |
| Avg. Fin.¹ | 8.13 | 1st of 34 | 12th of 274 |
| Completed Laps%¹ | 98.64% | 8th of 34 | 47th of 274 |
| Laps in Top15%¹ | 85.47% | 2nd of 34 | 36th of 274 |
| Avg. Driver Rating¹ | 106.04 | 2nd of 34 | 18th of 274‡ |
| Wins | 3 | 1st of 84 | T7th of 646 |
| Poles | 2 | 2nd of 84 | T11th of 646 |
| Top 2’s | 3 | T3rd of 84 | T21st of 646 |
| Top 3’s | 3 | T4th of 84 | T36th of 646 |
| Top 5’s | 9 | T1st of 84 | T7th of 646 |
| Top 10’s | 13 | T1st of 84 | T4th of 646 |
| DNF’s¹ | 1 | T5th of 34 | T34th of 274 |
| Stage Wins | 3 | T4th of 84 | T21st of 561* |
| Stage T10s | 21 | T5th of 84 | T30th of 561* |
| Stage Pts | 147 | 3rd of 84 | T16th of 561* |
| Playoff Pts² | 18 | 1st of 84 | T7th of 561* |
ªSince Playoffs started in 2016
¹Ranks of drivers to start 45% of races thru 16 races
²Earned from races only, does not reflect penalties
*Stage racing started in 2017
‡Max Driver Rating is 150.0
- Notable Streaks this year
- 4 straight Top 5 finishes (tied longest streak in Xfinity Series this year)
- 2 straight Top 5 finishes (active streak, longest active streak in Xfinity Series)
- 7 straight Top 10 finishes (active streak)
- 2023 Superspeedway Stats (Avg. Fin. and Driver Rating rank among drivers with 1+ Superspeedway start, 49 drivers)
- 3 Races, Avg. Finish 6.67(2nd), 89.49% of Laps ran in Top15, Avg. Driver Rating 120.67(1st), Best 1st, Worst 18th, Laps Completed 100%, Led 38.14% of laps he ran, 2 Wins, 2 Poles, 2 Top 3’s, 2 Top 5’s, 2 Top 10’s, 2 Top 15’s, 0 Finishes out of Top 20, 0 DNF’s, 2 Stage Wins, 7.0 Stage Pts Per Stage
- Atlanta Statistics
- 2023 Spring Atlanta race
- Finished 1st, Started 3rd, Led 103 laps (63.19%), Finished 1st in Stage 1 and 8th in Stage 2, ran 153 Laps in Top15 (93.87% of laps he ran), had 141.3 Driver Rating (ranked 1st)
- Notable Atlanta Statistics (Ranks are of drivers with 1+ start this year and 1+ start at Atlanta, 64 drivers)
- 3 Races
- 1.33 Avg. Finish (Ranks 1st)
- Best Finish: 1st, Worst: 2nd
- Completed 100% of laps (% ranks T1st)
- 95.98% of Laps ran in Top15 (% ranks 4th)
- 128.4 Average Driver Rating (Ranks 2nd)
- Led 40.76% of laps he’s run (% ranks 1st)
- 2 Wins, 66.67% (% ranks 1st)
- 3 Top 2’s, 100% (% ranks 1st)
- 0 finishes outside Top 20, 0.00% (% ranks T1st)
- 0 DNF’s, 0.00% (% ranks T1st)
- 2 Stage Wins, 33.33% (% ranks 3rd)
- 6 Stage T10’s, 100% (% ranks T1st)
- 5.83 Stage Pts Per Stage (Ranks 1st)
Austin Hill is notable because of his career Atlanta stats. Hill ran between 3rd and 5th all race at Chicago, finishing 5th. This was Hill’s 2nd straight Top 5 and 7th straight Top 10. In addition it was his 9th Top 5 and 13th Top 10 on the year, both of which are tied for the most in the Xfinity Series this year. Adding to this he has the best Avg. Finish at 8.13, the 2nd best Avg. Driver Rating at 106.04, the most Wins at 3, the 3rd most Stage Pts at 147, and the most Playoff Pts at 18. What’s better is Hill’s stats in the 3 Superspeedway races this year as he has 2 Wins and an 18th place finish. This gives him a 6.67 Avg. Finish (2nd best) and his races as a whole give him a 120.67 Avg. Driver Rating (1st best). In addition he’s ran 89.49% of his laps in the Top 15, led 38% of his laps, has 2 Stage Wins, and has gotten a whopping 7.0 Stage Pts Per Stage. At Atlanta this Spring Hill dominated leading 63% of the race, spending 94% of his laps in the Top 15, and ended up with the best Driver Rating at 141.3. Oh, he also won Stage 1 and the race. This is very typical of Hill at Atlanta, in 3 races he’s won 2 and finished 2nd in the other giving him a 1.33 Avg. Finish. Moreover he’s ran 96% of his laps in the Top 15, led 41% of his laps, has a superb Avg. Driver Rating of 128.4, and has gotten 5.83 Stage Pts Per Stage. Based on the numbers I expect Hill will run great this weekend and, as long as he avoids trouble, will finish in the Top 5.
3rd in Points – Cole Custer
| Category | Statistic | 2023 Rank | ªRank Thru 16 Races |
| Avg. Fin.¹ | 9.13 | 3rd of 34 | 20th of 274 |
| Completed Laps%¹ | 99.92% | 1st of 34 | T4th of 274 |
| Laps in Top15%¹ | 85.38% | 3rd of 34 | 37th of 274 |
| Avg. Driver Rating¹ | 101.61 | 4th of 34 | 32nd of 274‡ |
| Wins | 2 | T2nd of 84 | T14th of 646 |
| Poles | 4 | 1st of 84 | T2nd of 646 |
| Top 2’s | 2 | T5th of 84 | T36th of 646 |
| Top 3’s | 5 | 3rd of 84 | T21st of 646 |
| Top 5’s | 7 | T4th of 84 | T20th of 646 |
| Top 10’s | 11 | T3rd of 84 | T18th of 646 |
| DNF’s¹ | 0 | T1st of 34 | T1st of 274 |
| Stage Wins | 5 | 1st of 84 | T7th of 561* |
| Stage T10s | 23 | T2nd of 84 | T17th of 561* |
| Stage Pts | 140 | 4th of 84 | 22nd of 561* |
| Playoff Pts² | 15 | 2nd of 84 | T11th of 561* |
ªSince Playoffs started in 2016
¹Ranks of drivers to start 45% of races thru 16 races
²Earned from races only, does not reflect penalties
*Stage racing started in 2017
‡Max Driver Rating is 150.0
- Notable Streaks this year
- 2 straight Poles (active streak, tied 10th longest Xfinity Series streak all-time)
- 3 straight Top 3 finishes
- 10 straight Top 10 finishes (active streak, longest Xfinity Series Streak this year)
- 2023 Superspeedway Stats (Avg. Fin. and Driver Rating rank among drivers with 1+ Superspeedway start, 49 drivers)
- 3 Races, Avg. Finish 8.33(3rd), 73.35% of Laps ran in Top15, Avg. Driver Rating 85.67(10th), Best 4th, Worst 12th, Laps Completed 100%, Led 0.24% of laps he ran, 0 Wins, 0 Poles, 0 Top 3’s, 1 Top 5, 2 Top 10’s, 3 Top 15’s, 0 Finishes out of Top 20, 0 DNF’s, 0 Stage Wins, 1.0 Stage Pts Per Stage
- Atlanta Statistics
- 2023 Spring Atlanta race
- Finished 12th, Started 8th, Led 0 laps, Finished 9th in Stage 1 and 9th in Stage 2, ran 140 Laps in Top15 (85.89% of laps he ran), had 84.6 Driver Rating (ranked 15th)
- Notable Atlanta Statistics (Ranks are of drivers with 1+ start this year and 1+ start at Atlanta, 64 drivers)
- 4 Races
- 15.75 Avg. Finish (Ranks 20th)
- Best Finish: 2nd, Worst: 39th
- Completed 76.53% of laps (% ranks 57th)
- 92.38% of Laps ran in Top15 (% ranks 7th)
- 82.33 Average Driver Rating (Ranks 22nd)
- Led 0.4% of laps he’s run (% ranks T19th)
- 0 Wins
- 1 Top 2, 25.0% (% ranks 4th)
- 2 Top 10’s, 50.0% (% ranks T15th)
- 3 Top 15’s, 75.0% (% ranks T11th)
- 1 finish outside Top 20, 25.0% (% ranks T22nd)
- 1 DNF, 25.0% (% ranks T47th)
- 0 Stage Wins
- 6 Stage T10’s, 75.0% (% ranks T6th)
- 3.75 Stage Pts Per Stage (Ranks 7th)
Cole Custer is notable because of his 2023 stats thru 16 races. Custer dominated the Chicago weekend winning the Pole and leading every lap en route to his 2nd Win of the season. Additionally this was 2nd straight Pole and 10th straight Top 10 finish, the longest such Xfinity streak this year. Furthermore he now has 5 Stage Wins and 4 Poles this year, both of which are most this year and are Top 10 in the Rank thru 16 Races column above. What’s even more impressive is that all of his 2023 Ranks above are 5th or better with most of them being 3rd or better at that. As far as 2023 Superspeedway’s go Custer has been pretty consistent as he’s finished between 4th and 12th in all 3 races. Overall he has an 8.33 Avg. Finish (3rd best), an 85.67 Avg. Driver Rating, and he’s ran 73.35% of his laps in the Top 15; but he’s only led 0.24% of his laps and has just 1 Stage Pt Per Stage with 0 Stage Wins. The Spring Atlanta race was Custer’s worst of the 3 races as he finished 12th. In the race he led 0 laps, got 4 Stage Pts, ran 86% of his laps in the Top 15, and left with a 84.6 Driver Rating (15th best). This was Custer’s only start at the new Atlanta, but overall he has 4 starts here, a 15.75 Avg. Finish, 1 Top 5, and 1 DNF. Furthermore he’s only led 0.4% of his laps, but he has ran 92% of his laps in the Top 15. Atlanta has never been too kind to Custer and this weekend will be no different, he may squeak out a Top 10 but the best he finishes is 8th.
4th in Points – Justin Allgaier
| Category | Statistic | 2023 Rank | ªRank Thru 16 Races |
| Avg. Fin.¹ | 9.88 | 4th of 34 | T29th of 274 |
| Completed Laps%¹ | 94.69% | T15th of 34 | T111th of 274 |
| Laps in Top15%¹ | 80.12% | 5th of 34 | 53rd of 274 |
| Avg. Driver Rating¹ | 102.77 | 3rd of 34 | 31st of 274‡ |
| Wins | 1 | T5th of 84 | T32nd of 646 |
| Poles | 1 | T3rd of 84 | T17th of 646 |
| Top 2’s | 4 | 2nd of 84 | T13th of 646 |
| Top 3’s | 8 | 1st of 84 | T1st of 646 |
| Top 5’s | 9 | T1st of 84 | T7th of 646 |
| Top 10’s | 11 | T3rd of 84 | T18th of 646 |
| DNF’s¹ | 3 | T25th of 34 | T141st of 274 |
| Stage Wins | 4 | T2nd of 84 | T14th of 561* |
| Stage T10s | 22 | 4th of 84 | T25th of 561* |
| Stage Pts | 155 | 2nd of 84 | 13th of 561* |
| Playoff Pts² | 9 | 4th of 84 | 21st of 561* |
ªSince Playoffs started in 2016
¹Ranks of drivers to start 45% of races thru 16 races
²Earned from races only, does not reflect penalties
*Stage racing started in 2017
‡Max Driver Rating is 150.0
- Notable Streaks this year
- 3 straight Top 2 finishes (longest streak in Xfinity Series this year, tied 26th longest streak all-time)
- 4 straight Top 3 finishes (longest streak in Xfinity Series this year, tied 29th longest streak all-time
- 4 straight Top 5 finishes (tied longest streak in Xfinity Series this year)
- 5 straight Top 10 finishes
- 2023 Superspeedway Stats (Avg. Fin. and Driver Rating rank among drivers with 1+ Superspeedway start, 49 drivers)
- 3 Races, Avg. Finish 20.0(23rd), 75.5% of Laps ran in Top15, Avg. Driver Rating 84.6(12th), Best 3rd, Worst 29th, Laps Completed 73.84%, Led 14.24% of laps he ran, 0 Wins, 0 Poles, 1 Top 3, 1 Top 5, 1 Top 10, 1 Top 15, 2 Finishes out of Top 20, 2 DNF’s, 2 Stage Wins, 4.83 Stage Pts Per Stage
- Atlanta Statistics
- 2023 Spring Atlanta race
- Finished 29th (crash), Started 19th, Led 0 laps, got 0 Stage T10’s, ran 36 Laps in Top15 (46.75% of laps he ran), had 50.7 Driver Rating (ranked 25th)
- Notable Atlanta Statistics (Ranks are of drivers with 1+ start this year and 1+ start at Atlanta, 64 drivers)
- 15 Races
- 12.2 Avg. Finish (Ranks 15th)
- Best Finish: 1st, Worst: 34th
- Completed 95.68% of laps (% ranks 36th)
- 78.66% of Laps ran in Top15 (% ranks 14th)
- 92.55 Average Driver Rating (Ranks 14th)
- Led 3.28% of laps he’s run (% ranks 7th)
- 1 Win, 6.67% (% ranks 5th)
- 3 Top 5’s, 20.0% (% ranks T15th)
- 9 Top 10’s, 60.0% (% ranks 14th)
- 3 finishes outside Top 20, 20.0% (% ranks T19th)
- 2 DNF’s, 13.33% (% ranks 42nd)
- 0 Stage Wins
- 3.61 Stage Pts Per Stage (Ranks 8th)
Justin Allgaier is notable because he’s 4th in points thru 16 races. At Chicago Allgaier did the best he could in the short time span as he started 5th and moved up to 3rd by the end of the race. This race improved Allgaier’s Avg. Finish to 9.88 (4th best), his Laps in Top15% to 80.12 (5th best), and his Avg. Driver Rating to 102.77 (3rd best). Furthermore this was his 8th Top 3 finish, which is tied for the most Top 3’s thru 16 races since 2016, and is the most of any driver this year. Unfortunately for him 5 of the 8 races where he hasn’t finished in the Top 3 have also not resulted in a Top 10, with 3 of them ending in a DNF. However, there is more good news for him as he’s tied for the 2nd most Stage Wins this year (4) and the 2nd most Stage Pts this year as well (155). Now for bad news, Allgaier has 2 DNF’s and only 1 Top 15 finish (3rd at Daytona) in the 3 Superspeedway races giving him a 20.0 Avg. Finish. However, he’s ran 75.5% of his laps in the Top 15, led 14% of his laps, has a modest 84.6 Avg. Driver Rating, 2 Stage Wins, and 4.83 Stage Pts Per Stage. In the Spring Atlanta race Allgaier wrecked out to a 29th place finish with the 25th best Driver Rating (50.7) after running just 47% of his laps in the Top 15. Overall here he has 15 starts, 1 Win, 3 Top 5’s, a 12.2 Avg. Finish, 2 DNF’s, and a 92.55 Avg. Driver Rating. In all Allgaier may run well for most of the race this weekend, but in the end he’ll either finish with a Top 10 or a DNF.
5th in Owner in Points – Justin Haley
| Category | Statistic | 2023 Rank | ªRank Thru 16 Races |
| Avg. Fin.¹ | 10.67 | – of 34 | – of 274 |
| Completed Laps%¹ | 99.8% | – of 34 | – of 274 |
| Laps in Top15%¹ | 78.03% | – of 34 | – of 274 |
| Avg. Driver Rating¹ | 86.8 | – of 34 | – of 274‡ |
| Wins | 0 | T12th of 84 | T77th of 646 |
| Poles | 0 | T9th of 84 | T58th of 646 |
| Top 2’s | 0 | T18th of 84 | T121st of 646 |
| Top 3’s | 0 | T20th of 84 | T148th of 646 |
| Top 5’s | 0 | T27th of 84 | T197th of 646 |
| Top 10’s | 2 | T20th of 84 | T157th of 646 |
| DNF’s¹ | 0 | – of 34 | – of 274 |
| Stage Wins | 0 | T14th of 84 | T92nd of 561* |
| Stage T10s | 2 | T24th of 84 | T172nd of 561* |
| Stage Pts | 0 | T25th of 84 | T195th of 561* |
| Playoff Pts² | 0 | T12th of 84 | T71st of 561* |
ªSince Playoffs started in 2016
¹Ranks of drivers to start 45% of races thru 16 races
²Earned from races only, does not reflect penalties
*Stage racing started in 2017
‡Max Driver Rating is 150.0
- Notable Streaks this year
- 2 straight Top 10 finishes of races he’s ran
- 2023 Superspeedway Stats (Avg. Fin. and Driver Rating rank among drivers with 1+ Superspeedway start, 49 drivers)
- 2 Races, Avg. Finish 10.0(T5th), 79.17% of Laps ran in Top15, Avg. Driver Rating 90.5(5th), Best 10th, Worst 10th, Laps Completed 100%, Led 2.08% of laps he ran, 0 Wins, 0 Poles, 0 Top 3’s, 0 Top 5’s, 2 Top 10’s, 2 Top 15’s, 0 Finishes out of Top 20, 0 DNF’s, 0 Stage Wins, 2 Stage T10’s
- Atlanta Statistics
- 2023 Spring Atlanta race
- Finished 10th, Started 18th, Led 5 laps (3.07%), Finished 10th in Stage 1, ran 146 Laps in Top15 (89.57% of laps he ran), had 94.5 Driver Rating (ranked 7th)
- Notable Atlanta Statistics (Ranks are of drivers with 1+ start this year and 1+ start at Atlanta, 64 drivers)
- 5 Races
- 6.6 Avg. Finish (Ranks 5th)
- Best Finish: 3rd, Worst: 10th
- Completed 100% of laps (% ranks T1st)
- 93.75% of Laps ran in Top15 (% ranks 6th)
- 100.72 Average Driver Rating (Ranks 7th)
- Led 1.59% of laps he’s run (% ranks 13th)
- 0 Top 2’s
- 1 Top 3, 20.0% (% ranks T8th)
- 2 Top 5’s, 40.0% (% ranks 10th)
- 5 Top 10’s, 100% (% ranks T1st)
- 0 finishes outside Top 20, 0.00% (% ranks T1st)
- 0 DNF’s, 0.00% (% ranks T1st)
- 0 Stage Wins
- 7 Stage T10’s, 70.0% (% ranks 8th)
Justin Haley is notable because of his stats here at Atlanta in his 5 Xfinity starts. The last Xfinity race for Haley was at Charlotte where he ran 76% of his laps in the Top 15 and finished 12th. This was Haley’s 3rd race this year and in those races he has finishes of 10th, 10th, and 12th. Overall he’s completed 99.8% of the laps, has ran 78% of his laps in the Top 15, and has an 86.8 Avg. Driver Rating. His two 10th place finishes have come in the 2 Superspeedway races he’s competed in (Daytona and Atlanta) where he spent 79% of his laps in the Top 15, had a 90.5 Avg. Driver Rating, led 2.08% of his laps, and 2 Stage T10’s. As mentioned one of these races was at Atlanta where Haley finished 10th, led 5 laps, and spent 89.57% of his laps in the Top 15 earning himself the 7th best Driver Rating of the day at 94.5. This was Haley’s 5th race at Atlanta and was his worst finish. Overall he has a 6.6 Avg. Finish here with 1 Top 3, 2 Top 5’s, and 5 Top 10’s. Furthermore he’s completed every lap here in races he’s ran, ran 94% of his laps in the Top 15, has a 100.72 Avg. Driver Rating, and 7 Stage T10’s in 10 stages. All of the data suggests a good run for Haley this weekend as he’ll spend most of his day near the front, and if he doesn’t get caught up in a wreck will finish in the Top 10 with a high probability of it being a Top 5 or even a Win.
11th in Points – Riley Herbst
| Category | Statistic | 2023 Rank | ªRank Thru 16 Races |
| Avg. Fin.¹ | 16.38 | T13th of 34 | T97th of 274 |
| Completed Laps%¹ | 92.92% | 21st of 34 | 139th of 274 |
| Laps in Top15%¹ | 78.06% | 6th of 34 | 61st of 274 |
| Avg. Driver Rating¹ | 84.48 | 11th of 34 | T83rd of 274‡ |
| Wins | 0 | T12th of 84 | T77th of 646 |
| Poles | 0 | T9th of 84 | T58th of 646 |
| Top 2’s | 1 | T8th of 84 | T58th of 646 |
| Top 3’s | 1 | T13th of 84 | T83rd of 646 |
| Top 5’s | 3 | T7th of 84 | T66th of 646 |
| Top 10’s | 7 | T8th of 84 | T65th of 646 |
| DNF’s¹ | 4 | T31st of 34 | T206th of 274 |
| Stage Wins | 0 | T14th of 84 | T92nd of 561* |
| Stage T10s | 21 | T5th of 84 | T30th of 561* |
| Stage Pts | 97 | 7th of 84 | T45th of 561* |
| Playoff Pts² | 0 | T12th of 84 | T71st of 561* |
ªSince Playoffs started in 2016
¹Ranks of drivers to start 45% of races thru 16 races
²Earned from races only, does not reflect penalties
*Stage racing started in 2017
‡Max Driver Rating is 150.0
- Notable Streaks this year
- 2 straight Top 5 finishes
- 6 straight Top 10 finishes
- 2023 Superspeedway Stats (Avg. Fin. and Driver Rating rank among drivers with 1+ Superspeedway start, 49 drivers)
- 3 Races, Avg. Finish 11.33(8th), 84.17% of Laps ran in Top15, Avg. Driver Rating 93.5(4th), Best 5th, Worst 23rd, Laps Completed 97.31%, Led 2.76% of laps he ran, 0 Wins, 0 Poles, 0 Top 3’s, 1 Top 5, 2 Top 10’s, 2 Top 15’s, 1 Finish out of Top 20, 1 DNF, 0 Stage Wins, 3.33 Stage Pts Per Stage
- Atlanta Statistics
- 2023 Spring Atlanta race
- Finished 5th, Started 5th, Led 11 laps (6.75%), Finished 5th in Stage 1 and 2nd in Stage 2, ran 148 Laps in Top15 (90.8% of laps he ran), had 106.0 Driver Rating (ranked 5th)
- Notable Atlanta Statistics (Ranks are of drivers with 1+ start this year and 1+ start at Atlanta, 64 drivers)
- 6 Races
- 10.0 Avg. Finish (Ranks T11th)
- Best Finish: 4th, Worst: 19th
- Completed 100% of laps (% ranks T1st)
- 65.79% of Laps ran in Top15 (% ranks 21st)
- 86.7 Average Driver Rating (Ranks 19th)
- Led 1.11% of laps he’s run (% ranks 16th)
- 0 Top 3’s
- 2 Top 5’s, 33.33% (% ranks T12th)
- 4 Top 10’s, 66.67% (% ranks T9th)
- 4 Top 15’s, 66.67% (% ranks T16th)
- 0 finishes outside Top 20, 0.00% (% ranks T1st)
- 0 DNF’s, 0.00% (% ranks T1st)
- 0 Stage Wins
- 2.08 Stage Pts Per Stage (Ranks 16th)
Riley Herbst is notable because of his stats in the 3 Superspeedway races this year. The Chicago race started well for Herbst, but quickly went bad after early damage caused him to pit and only be able to get back up to 24th. This was Herbst’s 9th finish out of the Top 10 in the last 10 races and brings his Avg. Finish to a bleak 16.38 (T13th best). However, it’s not all terrible as on the year he’s spent 78% of his laps in the Top 15 (6th best), has an 84.48 Avg. Driver Rating (11th best), 3 Top 5’s (T7th best), 7 Top 10’s (T8th best), and 21 Stage T10’s (T5th best) with 97 Stage Pts (7th best). However, the news gets even better when looking at Herbst’s stats in the 3 Superspeedway races this year. Overall he has an 11.33 Avg. Finish (8th best) with 1 Top 5, 2 Top 10’s, and a worst finish of 23rd (a DNF at Talladega). Furthermore he’s spent 84% of his laps in the Top 15, has the 4th best Avg. Driver Rating at 93.5, and has collected 3.33 Stage Pts Per Stage. His best finish in the 3 races was at Atlanta this Spring as 5’s were wild with him starting 5th, finishing 5th in Stage 1, having the 5th best Driver Rating at 106.0, and finishing 5th in the race. This was Herbst’s 6th race here and in those races he has 2 Top 5’s, 4 Top 10’s, and a worst finish of 19th leading to a 10.0 Avg. Finish. All of the data seems to say Herbst will have a decent race this weekend finishing somewhere between 5th and 20th.
12th in Points – Parker Kligerman
| Category | Statistic | 2023 Rank | ªRank Thru 16 Races |
| Avg. Fin.¹ | 15.63 | 11th of 34 | 85th of 274 |
| Completed Laps%¹ | 92.01% | 24th of 34 | 153rd of 274 |
| Laps in Top15%¹ | 60.31% | 13th of 34 | 106th of 274 |
| Avg. Driver Rating¹ | 81.71 | 12th of 34 | 95th of 274‡ |
| Wins | 0 | T12th of 84 | T77th of 646 |
| Poles | 0 | T9th of 84 | T58th of 646 |
| Top 2’s | 0 | T18th of 84 | T121st of 646 |
| Top 3’s | 1 | T13th of 84 | T83rd of 646 |
| Top 5’s | 3 | T7th of 84 | T66th of 646 |
| Top 10’s | 6 | T11th of 84 | T83rd of 646 |
| DNF’s¹ | 1 | T5th of 34 | T34th of 274 |
| Stage Wins | 1 | T10th of 84 | T57th of 561* |
| Stage T10s | 15 | 12th of 84 | T64th of 561* |
| Stage Pts | 57 | 13th of 84 | T70th of 561* |
| Playoff Pts² | 1 | T10th of 84 | T56th of 561* |
ªSince Playoffs started in 2016
¹Ranks of drivers to start 45% of races thru 16 races
²Earned from races only, does not reflect penalties
*Stage racing started in 2017
‡Max Driver Rating is 150.0
- Notable Streaks this year
- none
- 2023 Superspeedway Stats (Avg. Fin. and Driver Rating rank among drivers with 1+ Superspeedway start, 49 drivers)
- 3 Races, Avg. Finish 10.0(T5th), 73.84% of Laps ran in Top15, Avg. Driver Rating 90.73(6th), Best 3rd, Worst 23rd, Laps Completed 100%, Led 1.47% of laps he ran, 0 Wins, 0 Poles, 1 Top 3, 2 Top 5’s, 2 Top 10’s, 2 Top 15’s, 1 Finish out of Top 20, 0 DNF’s, 1 Stage Win, 3.0 Stage Pts Per Stage
- Atlanta Statistics
- 2023 Spring Atlanta race
- Finished 4th, Started 13th, Led 5 laps (3.07%), Finished 1st in Stage 2, ran 149 Laps in Top15 (91.41% of laps he ran), had 118.0 Driver Rating (ranked 2nd)
- Notable Atlanta Statistics (Ranks are of drivers with 1+ start this year and 1+ start at Atlanta, 64 drivers)
- 2 Races
- 10.0 Avg. Finish (Ranks T11th)
- Best Finish: 4th, Worst: 16th
- Completed 100% of laps (% ranks T1st)
- 57.26% of Laps ran in Top15 (% ranks 23rd)
- 95.75 Average Driver Rating (Ranks 11th)
- Led 1.4% of laps he’s run (% ranks 14th)
- 0 Top 3’s
- 1 Top 5, 50.0% (% ranks T6th)
- 1 Top 10, 50.0% (% ranks T23rd)
- 0 finishes outside Top 20, 0.00% (% ranks T1st)
- 0 DNF’s, 0.00% (% ranks T1st)
- 1 Stage Win, 50.0 (% ranks T1st)
- 5.0 Stage Pts Per Stage (Ranks T2nd)
Parker Kligerman is notable because of how he did in the Spring Atlanta race this year. At Chicago Kligerman ran either 9th or 10th all race, ending up 9th at the finish. This was Kligerman’s 6th Top 10 of the year (ranks T11th) and the race improved his Avg. Finish to 15.63 (ranks 11th), Laps in Top15% to 60.31 (ranks 13th), and Avg. Driver Rating to 81.71 (ranks 12th). More stats for him this year are that he has 3 Top 5’s, 15 Stage T10’s, 57 Stage Pts, and 1 Stage Win. That Stage Win came at Atlanta this Spring and is just one of his really good Superspeedway stats this year. In the 3 races Kligerman has a 10.0 Avg. Finish (5th best) and a 90.73 Avg. Driver Rating (6th best) with 1 Top 3, 2 Top 5’s, and a worst finish of 23rd. Furthermore he’s completed every lap this year, ran 74% of those laps in the Top 15, and led 1.47% of those laps. Kligerman’s best of these races was at Atlanta where he ran 91.49% of his laps in the Top 15, won Stage 2, finished 4th in the race, and had the 2nd best Driver Rating at 118.0. This was Kligerman’s 2nd race at Atlanta in the Xfinity Series, and his first came in 2013. Nevertheless he has a 10.0 Avg. Finish here, has ran 57.26% of his laps in the Top 15, a 95.75 Avg. Driver Rating, and 5.0 Stage Pts Per Stage. All of the success Kligerman has had on Superspeedway’s this year makes me believe he will run well this weekend and probably end up between 1st and 7th.
13th in Points – Jeb Burton
| Category | Statistic | 2023 Rank | ªRank Thru 16 Races |
| Avg. Fin.¹ | 15.81 | 12th of 34 | 13th of 274 |
| Completed Laps%¹ | 99.88% | 2nd of 34 | 50th of 274 |
| Laps in Top15%¹ | 42.69% | 15th of 34 | 122nd of 274 |
| Avg. Driver Rating¹ | 71.76 | 15th of 34 | 125th of 274‡ |
| Wins | 1 | T5th of 84 | T32nd of 646 |
| Poles | 0 | T9th of 84 | T58th of 646 |
| Top 2’s | 1 | T8th of 84 | T58th of 646 |
| Top 3’s | 1 | T13th of 84 | T83rd of 646 |
| Top 5’s | 1 | T16th of 84 | T123rd of 646 |
| Top 10’s | 2 | T20th of 84 | T157th of 646 |
| DNF’s¹ | 0 | T1st of 34 | T1st of 274 |
| Stage Wins | 1 | T10th of 84 | T57th of 561* |
| Stage T10s | 6 | T16th of 84 | T111th of 561* |
| Stage Pts | 26 | 16th of 84 | T98th of 561* |
| Playoff Pts² | 6 | 7th of 84 | T29th of 561* |
ªSince Playoffs started in 2016
¹Ranks of drivers to start 45% of races thru 16 races
²Earned from races only, does not reflect penalties
*Stage racing started in 2017
‡Max Driver Rating is 150.0
- Notable Streaks this year
- none
- 2023 Superspeedway Stats (Avg. Fin. and Driver Rating rank among drivers with 1+ Superspeedway start, 49 drivers)
- 3 Races, Avg. Finish 9.33(4th), 50.12% of Laps ran in Top15, Avg. Driver Rating 90.47(7th), Best 1st, Worst 16th, Laps Completed 100%, Led 4.16% of laps he ran, 1 Win, 0 Poles, 1 Top 3, 1 Top 5, 1 Top 10, 2 Top 15’s, 0 Finishes out of Top 20, 0 DNF’s, 1 Stage Win, 4.0 Stage Pts Per Stage
- Atlanta Statistics
- 2023 Spring Atlanta race
- Finished 16th, Started 16th, Led 0 laps, got 0 Stage T10’s, ran 27 Laps in Top15 (16.56% of laps he ran), had 72.9 Driver Rating (ranked 18th)
- Notable Atlanta Statistics (Ranks are of drivers with 1+ start this year and 1+ start at Atlanta, 64 drivers)
- 6 Races
- 13.5 Avg. Finish (Ranks T17th)
- Best Finish: 2nd, Worst: 25th
- Completed 99.9% of laps (% ranks T16th)
- 52.89% of Laps ran in Top15 (% ranks 25th)
- 79.12 Average Driver Rating (Ranks 25th)
- Led 0.2% of laps he’s run (% ranks 23rd)
- 0 Wins
- 1 Top 2, 16.67% (% ranks 8th)
- 2 Top 10’s, 33.33% (% ranks T21st)
- 4 Top 15’s, 66.67% (% ranks T16th)
- 1 finish outside Top 20, 16.67% (% ranks T17th)
- 0 DNF’s, 0.00% (% ranks T1st)
- 0 Stage Wins
- 3 Stage T10’s, 30.0% (% ranks 22nd)
Jeb Burton is notable because of how he’s performed on Superspeedways this year. Burton ran around 20th all day at Chicago coming home 19th. This hurt Burton’s Avg. Finish as it now sits at 15.81 (12th best), his Avg. Driver Rating as it now sits at 71.76 (15th best), and his Laps in Top15% as it now sits at 42.69 (15th best). More bad news is that he only 2 Top 10’s, 6 Stage T10’s, and 26 Stage Pts this year. The good news is that he has 1 Win, 1 Stage Win, and 0 DNF’s as well, but heading to a Superspeedway this weekend the 0 DNF’s may be in jeopardy. However, Burton has ran well in the 3 Superspeedway races this year as he has the 4th best Avg. Finish at 9.33 and the 7th best Avg. Driver Rating at 90.47 with a best finish of 1st and worst of 16th. Furthermore he’s led 4.16% of his laps, acquired 1 Stage Win, and 4.0 Stage Pts Per Stage; but he’s also only ran 50% of his laps in the Top 15. More bad news is that his worst of the 3 races was at Atlanta where he started 16th, finished 16th, ran only 16.56% of the laps in the of his laps in the Top 15, and had the 18th best Avg. Driver Rating at 72.9. This was Burton’s 6th race at Atlanta and in those races he has a 13.5 Avg. Finish with 2 Top 10’s, 4 Top 15’s, and a 79.12 Avg. Driver Rating. This weekend I see being a bit of a struggle for Burton as he’s not really ran well at Superspeedway Atlanta, and for that reason I see him finishing somewhere between 9th and 20th.