
P = Playoff Driver
OP = Owner Playoff Driver
1st in Points – William Byron (P & OP)
| Category | Statistic | 2023 Rank | ªRank Thru 32 Races |
| Avg. Fin.¹ | 11.47 | 1st of 35 | T47th of 825 |
| Completed Laps%¹ | 97.05% | 16th of 35 | T242nd of 825 |
| Laps in Top15%¹ | 73.32% | 2nd of 35 | 106th of 781‡ |
| Avg. Driver Rating¹ | 98.08 | 1st of 35 | 73rd of 781‡ |
| Wins | 6 | 1st of 63 | T11th of 1396 |
| Poles | 3 | 3rd of 63 | T35th of 1396 |
| Top 2’s | 9 | 1st of 63 | T18th of 1396 |
| Top 3’s | 10 | T1st of 63 | T29th of 1396 |
| Top 5’s | 13 | T1st of 63 | T38th of 1396 |
| Top 10’s | 18 | 1st of 63 | T66th of 1396 |
| DNF’s¹ | 3 | T6th of 35 | T266th of 825 |
| Stage Wins | 8 | 1st of 63 | T10th of 439* |
| Stage T10s | 38 | T4th of 63 | T35th of 439* |
| Stage Pts | 272 | 1st of 63 | T16th of 439* |
| Playoff Pts² | 38 | 1st of 63 | 7th of 439* |
ªSince Playoffs started in 2004
¹Ranks of drivers to start 40% of races thru 31 races
²Earned from races only, does not reflect penalties
*Stage racing started in 2017
‡Loop Data started in 2005, max Driver Rating is 150.0
- 2023 Playoff Statistics (Avg. Fin. and Driver Rating rank among drivers with 3+ Playoff starts, 35 drivers)
- 6 Races, Avg. Finish 5.5(1st), 76.1% of Laps ran in Top15, Avg. Driver Rating 98.57(4th), Best 1st, Worst 15th, Laps Completed 100%, Led 1.06% of laps he ran, 1 Win, 0 Poles, 3 Top 3’s, 4 Top 5’s, 5 Top 10’s, 0 Finishes out of Top 20, 0 DNF’s, 0 Stage Wins, 6 Stage T10’s, 3.42 Stage Pts Per Stage, 5 Playoff Pts earned in races
- Notable Streaks this year
- 2 straight Wins (tied longest streak in Cup Series this year)
- 3 straight Top 2 finishes (active streak, longest active streak and longest streak in Cup Series this year)
- 3 straight Top 3 finishes (active streak, longest active streak and tied longest streak in Cup Series this year)
- 3 straight Top 5 finishes (active streak, longest active streak in Cup Series)
- 4 straight Top 5 finishes (tied longest streak in Cup Series this year)
- 4 straight Top 10 finishes (active streak, longest active streak in Cup Series)
- 6 straight Top 10 finishes
- 2023 Intermediate Stats (Avg. Fin. and Driver Rating rank among drivers with 1+ Intermediate start, 45 drivers)
- 8 Races, Avg. Finish 4.13(1st), 78.69% of Laps ran in Top15, Avg. Driver Rating 111.63(1st), Best 1st, Worst 15th, Laps Completed 100%, Led 12.11% of laps he ran, 3 Wins, 1 Pole, 5 Top 3’s, 6 Top 5’s, 7 Top 10’s, 8 Top 15’s, 0 Finishes out of Top 20, 0 DNF’s, 3 Stage Wins, 4.94 Stage Pts Per Stage
- Las Vegas Statistics
- 2023 Spring Las Vegas race
- Finished 1st, Started 2nd, Led 176 laps (64.94%), Finished 1st in Stage 1 and 1st in Stage 2, ran 271 Laps in Top15 (100% of laps he ran), had 148.2 Driver Rating (ranked 1st)
- Notable Las Vegas Statistics (Ranks are of drivers with 1+ start this year and 1+ start at Las Vegas, 45 drivers)
- 11 Races
- 16.27 Avg. Finish (Ranks 13th)
- Best Finish: 1st, Worst: 37th
- Completed 97.73% of laps (% ranks 21st)
- 73.09% of Laps ran in Top15 (% ranks 8th)
- 93.32 Average Driver Rating (Ranks 9th)
- Led 8.83% of laps he’s run (% ranks 4th)
- 1 Win, 9.09% (% ranks 4th)
- 2 Top 5’s, 18.18% (% ranks 14th)
- 5 Top 15’s, 45.45% (% ranks 18th)
- 4 finishes outside Top 20, 36.36% (% ranks 16th)
- 1 DNF, 9.09% (% ranks 30th)
- 2 Stage Wins, 9.09% (% ranks T4th)
- 14 Stage T10’s, 63.64% (% ranks 8th)
- 3.68 Stage Pts Per Stage (Ranks 8th)
– William Byron is notable because of his stats in the Spring Las Vegas race this year
– Last week Byron ran 94.5% of his laps in the Top 15 en route to his series leading 9th Top 2 finish, coming home 2nd
– This was his 3rd straight Top 2 finish and his 7th Top 10 in the last 8 races
– 10 of his 15 2023 Ranks above are 1st or T1st including his 11.47 Avg. Finish, 98.08 Avg. Driver Rating, 6 Wins, 18 Top 10’s, 8 Stage Wins, and 272 Stage Pts
– His 6 Wins, 9 Top 2’s, 8 Stage Wins, 272 Stage Pts, and 38 Playoff Pts thru 32 races all rank better than 20th since 2004
– In 6 playoff races he has the best Avg. Finish (5.5) with 4 Top 5’s and a worst finish of only 15th
– He’s ran 76% of his laps in the playoffs in the Top 15 and has a 98.57 Avg. Driver Rating, but he’s only led 1% of the laps he’s run
– At Intermediate tracks this year he has the best Avg. Finish (4.13), 3 Wins, 6 Top 5’s, and a worst finish of 15th in 8 races
– He has the best Avg. Driver Rating in the 8 races (111.63), has led 12% of his laps, and has 4.94 Stage Pts Per Stage
– This Spring at Las Vegas Byron led 65% of the race, ran all 271 laps in the Top 15, and had the 3rd best Driver Rating of any driver in any race this year (148.2) en route to him winning the race
– This was his 2nd Top 5 finish in 11 races at Las Vegas and in the 11 races he has as many finishes out of the Top 20 as in the Top 10 (4)
– In the 11 races he has a 16.27 Avg. Finish, a 93.32 Avg. Driver Rating, has ran 73% of his laps in the Top 15, and led 9% of his laps here
Outlook for this weekend
Byron steps into the Round of 8 with a decent, but not comfortable points cushion. The 2023 stats above say he’s been the best driver this year by far, and his playoff stats back this up as he’s been fantastic in the playoffs. What’s more is that he’s been the best driver on Intermediate tracks this year as well. However, despite his win at Las Vegas this Spring, this track hasn’t been kind to him in his career. All this said I see Byron getting a 1st-8th place finish this weekend.
2nd in Points – Martin Truex Jr. (P)
| Category | Statistic | 2023 Rank | ªRank Thru 32 Races |
| Avg. Fin.¹ | 13.25 | 6th of 35 | T121st of 825 |
| Completed Laps%¹ | 96.43% | T21st of 35 | T298th of 825 |
| Laps in Top15%¹ | 65.36% | 10th of 35 | 187th of 781‡ |
| Avg. Driver Rating¹ | 92.17 | 4th of 35 | 150th of 781‡ |
| Wins | 3 | T2nd of 63 | T57th of 1396 |
| Poles | 1 | T8th of 63 | T129th of 1396 |
| Top 2’s | 5 | T4th of 63 | T70th of 1396 |
| Top 3’s | 8 | 3rd of 63 | T55th of 1396 |
| Top 5’s | 9 | T5th of 63 | T122nd of 1396 |
| Top 10’s | 15 | T5th of 63 | T160th of 1396 |
| DNF’s¹ | 2 | T4th of 35 | T116th of 825 |
| Stage Wins | 6 | T3rd of 63 | T17th of 439* |
| Stage T10s | 37 | 6th of 63 | T42nd of 439* |
| Stage Pts | 215 | T5th of 63 | T46th of 439* |
| Playoff Pts² | 21 | 3rd of 63 | T19th of 439* |
ªSince Playoffs started in 2004
¹Ranks of drivers to start 40% of races thru 31 races
²Earned from races only, does not reflect penalties
*Stage racing started in 2017
‡Loop Data started in 2005, max Driver Rating is 150.0
- 2023 Playoff Statistics (Avg. Fin. and Driver Rating rank among drivers with 3+ Playoff starts, 35 drivers)
- 6 Races, Avg. Finish 21.33(26th), 22.13% of Laps ran in Top15, Avg. Driver Rating 60.38(24th), Best 17th, Worst 36th, Laps Completed 100%, Led 0.00% of laps he ran, 0 Wins, 0 Poles, 0 Top 3’s, 0 Top 5’s, 0 Top 10’s, 1 Finish out of Top 20, 1 DNF, 0 Stage Wins, 3 Stage T10’s, 1.0 Stage Pts Per Stage, 0 Playoff Pts earned in races
- Notable Streaks this year
- 2 straight Top 2 finishes
- 4 straight Top 5 finishes (tied longest streak in Cup Series this year)
- 6 straight Top 10 finishes
- 2023 Intermediate Stats (Avg. Fin. and Driver Rating rank among drivers with 1+ Intermediate start, 45 drivers)
- 8 Races, Avg. Finish 15.25(13th), 76.1% of Laps ran in Top15, Avg. Driver Rating 90.61(7th), Best 2nd, Worst 36th, Laps Completed 88.5%, Led 12.85% of laps he ran, 0 Wins, 1 Pole, 2 Top 3’s, 2 Top 5’s, 4 Top 10’s, 4 Top 15’s, 2 Finishes out of Top 20, 2 DNF’s, 1 Stage Win, 3.65 Stage Pts Per Stage
- Las Vegas Statistics
- 2023 Spring Las Vegas race
- Finished 7th, Started 15th, Led 3 laps (1.11%), Finished 6th in Stage 1 and 4th in Stage 2, ran 262 Laps in Top15 (96.68% of laps he ran), had 105.6 Driver Rating (ranked 4th)
- Notable Las Vegas Statistics (Ranks are of drivers with 1+ start this year and 1+ start at Las Vegas, 45 drivers)
- 23 Races
- 10.0 Avg. Finish (Ranks 2nd)
- Best Finish: 1st, Worst: 32nd
- Completed 99.94% of laps (% ranks 1st)
- 76.18% of Laps ran in Top15 (% ranks 7th)
- 98.47 Average Driver Rating (Ranks 6th)
- Led 4.92% of laps he’s run (% ranks 11th)
- 2 Wins, 8.7% (% ranks 5th)
- 7 Top 5’s, 30.43% (% ranks 7th)
- 14 Top 10’s, 60.87% (% ranks 2nd)
- 18 Top 15’s, 78.26% (% ranks 4th)
- 1 finish outside Top 20, 4.35% (% ranks 1st)
- 0 DNF’s, 0.00% (% ranks T1st)
- 4 Stage Wins, 16.67% (% ranks 1st)
- 23 Stage T10’s, 95.83% (% ranks 1st)
- 5.71 Stage Pts Per Stage (Ranks 1st)
– Martin Truex Jr. is notable because he’s 2nd in points to start the Round of 8
– Truex’s playoff struggles continued at the Roval as he ran just 31% of his laps in the Top 15 and finished 20th, missing out on the Round of 8 owner cutoff by 1 point
– He’s now finished 7 straight races out of the Top 15 and has ran less than 40% of his laps in the Top 15 in 4 straight races
– His only 2023 Ranks above that aren’t T8th or better are his 65.36 Laps in Top 15% (10th) and his 96.43 Completed Laps% (T21st)
– Only 7 of his 2023 Ranks above are T4th or better including his 92.17 Avg. Driver Rating, 8 Top 3’s, and 6 Stage Wins
– In 6 playoff races he has a 21.33 Avg. Finish with a best finish of 17th, but also just 1 finish out of the Top 20
– In the 6 races he’s ran just 22% of his laps in the Top 15, has a 60.38 Avg. Driver Rating, and has gotten just 1.0 Stage Pts Per Stage
– In the 8 Intermediate races this year he has a 15.25 Avg. Finish with 2 Top 3’s and 4 Top 10’s
– He’s ran 76% of his laps in the Top 15 in these 8 races, led 13% of his laps, and his only finishes out of the Top 20 have been DNF’s
– At Las Vegas this Spring Truex led 3 laps, ran 97% of his laps in the Top 15, had the 4th best Driver Rating (105.6), and finished 7th
– In his 23 career Cup races at Las Vegas he has a 10.0 Avg. Finish with 2 Wins, 14 Top 10’s, and only 1 finish out of the Top 20
– His 99.94 Completed Laps%, 4.35 finish out of the Top 20%, 16.67 Stage Win%, 95.83 Stage T10%, and 5.71 Stage Pts Per Stage are all best among active drivers
Outlook for this weekend
Despite Truex’s amazing regular season he’s now out of the owner playoffs. It’s no secret his playoffs have been awful, but his 2023 Ranks above say he deserves a Round of 8 spot anyway. At Intermediates he’s been decent, but nothing too flashy unlike his Las Vegas stats. Here at Las Vegas he’s been pretty dang good in his career and did decent in the Spring race here as well. Overall this weekend I expect Truex’s struggles to reverse as he finishes between 5th and 12th.
3rd in Points – Denny Hamlin (P & OP)
| Category | Statistic | 2023 Rank | ªRank Thru 32 Races |
| Avg. Fin.¹ | 12.31 | 4th of 35 | T79th of 825 |
| Completed Laps%¹ | 96.63% | 18th of 35 | T278th of 825 |
| Laps in Top15%¹ | 80.24% | 1st of 35 | 42nd of 781‡ |
| Avg. Driver Rating¹ | 96.88 | 2nd of 35 | 89th of 781‡ |
| Wins | 3 | T2nd of 63 | T57th of 1396 |
| Poles | 4 | 2nd of 63 | T20th of 1396 |
| Top 2’s | 7 | 2nd of 63 | T38th of 1396 |
| Top 3’s | 10 | T1st of 63 | T29th of 1396 |
| Top 5’s | 13 | T1st of 63 | T38th of 1396 |
| Top 10’s | 16 | T2nd of 63 | T127th of 1396 |
| DNF’s¹ | 3 | T6th of 35 | T266th of 825 |
| Stage Wins | 7 | T2nd of 63 | T12th of 439* |
| Stage T10s | 41 | 1st of 63 | T21st of 439* |
| Stage Pts | 268 | 2nd of 63 | 19th of 439* |
| Playoff Pts² | 22 | 2nd of 63 | 18th of 439* |
ªSince Playoffs started in 2004
¹Ranks of drivers to start 40% of races thru 31 races
²Earned from races only, does not reflect penalties
*Stage racing started in 2017
‡Loop Data started in 2005, max Driver Rating is 150.0
- 2023 Playoff Statistics (Avg. Fin. and Driver Rating rank among drivers with 3+ Playoff starts, 35 drivers)
- 6 Races, Avg. Finish 12.17(6th), 78.28% of Laps ran in Top15, Avg. Driver Rating 101.3(2nd), Best 1st, Worst 37th, Laps Completed 98.0%, Led 23.12% of laps he ran, 1 Win, 0 Poles, 3 Top 3’s, 4 Top 5’s, 4 Top 10’s, 2 Finishes out of Top 20, 1 DNF, 2 Stage Wins, 8 Stage T10’s, 4.83 Stage Pts Per Stage, 7 Playoff Pts earned in races
- Notable Streaks this year
- 2 straight Top 2 finishes
- 3 straight Top 3 finishes (tied longest streak in Cup Series this year)
- 4 straight Top 5 finishes (tied longest streak in Cup Series this year)
- 2023 Intermediate Stats (Avg. Fin. and Driver Rating rank among drivers with 1+ Intermediate start, 45 drivers)
- 8 Races, Avg. Finish 11.75(7th), 88.46% of Laps ran in Top15, Avg. Driver Rating 108.74(3rd), Best 1st, Worst 35th, Laps Completed 91.13%, Led 17.76% of laps he ran, 1 Win, 0 Poles, 3 Top 3’s, 4 Top 5’s, 4 Top 10’s, 6 Top 15’s, 2 Finishes out of Top 20, 1 DNF, 4 Stage Wins, 4.94 Stage Pts Per Stage
- Las Vegas Statistics
- 2023 Spring Las Vegas race
- Finished 11th, Started 12th, Led 10 laps (3.69%), Finished 5th in Stage 1 and 8th in Stage 2, ran 263 Laps in Top15 (97.05% of laps he ran), had 105.2 Driver Rating (ranked 5th)
- Notable Las Vegas Statistics (Ranks are of drivers with 1+ start this year and 1+ start at Las Vegas, 45 drivers)
- 23 Races
- 12.78 Avg. Finish (Ranks 8th)
- Best Finish: 1st, Worst: 32nd
- Completed 98.62% of laps (% ranks 17th)
- 65.03% of Laps ran in Top15 (% ranks 12th)
- 90.74 Average Driver Rating (Ranks 11th)
- Led 6.06% of laps he’s run (% ranks T6th)
- 1 Win, 4.35% (% ranks 9th)
- 6 Top 5’s, 26.09% (% ranks 8th)
- 11 Top 10’s, 47.83% (% ranks 8th)
- 15 Top 15’s, 65.22% (% ranks 8th)
- 3 finishes outside Top 20, 13.04% (% ranks 3rd)
- 2 DNF’s, 8.7% (% ranks 29th)
- 2 Stage Wins, 8.33% (% ranks T6th)
- 3.88 Stage Pts Per Stage (Ranks 7th)
– Denny Hamlin is notable because of his stats in the 8 Intermediate races this year
– Hamlin struggled at the Roval running just 67% of his laps in the Top 15 and spinning out twice, ending in a 37th place DNF
– This broke his 4 race Top 5 streak
– Only his 12.31 Avg. Finish, 96.63 Completed Laps%, and 3 DNF’s are worse than 2nd in the 2023 Ranks above
– His 80.24 Laps in Top 15%, 10 Top 3’s, 13 Top 5’s, and 41 Stage T10’s are all either best or tied best this year
– He has a 12.17 Avg. Finish in the 6 playoff races this year with 1 Win, 3 Top 3’s, and 2 finishes out of the Top 20
– In the 6 races he’s ran 78% of his laps in the Top 15, has the 2nd best Avg. Driver Rating (101.3), and he’s led 23% of the laps he’s ran
– At Intermediates this year he’s ran 88.46% of his laps in the Top 15, led 18% of his laps, and has 4 Stage Wins in the 8 races
– In these 8 races he has an 11.75 Avg. Finish with a 108.74 Avg. Driver Rating, 1 Win, and 4 Top 5’s
– In the Las Vegas Spring race this year Hamlin ran 97% of his laps in the Top 15 and had the 5th best Driver Rating (105.2), but finished 11th
– In 23 career races at Las Vegas he has a 12.78 Avg. Finish with 1 Win and a Top 10 finish in less than half of his races
– He’s ran only 65% of his laps in the Top 15 in his 23 career races here, but has led 6% of his laps, and gotten 3.88 Stage Pts Per Stage
Outlook for this weekend
It’s a good thing Hamlin had a big points cushion heading to the Roval as he did terrible, but his stats show he’s still been one of the better drivers in the playoffs. Moreover, his 2023 stats above show he definitely deserves his Round of 8 spot, and heading to an Intermediate is good news as he’s done well on them. However, this is Las Vegas where he’s been not good, but also not too bad. All of his stats tell me that Hamlin gets a Top 5 finish or 10th-15th place finish this weekend.
4th in Points – Kyle Larson (P & OP)
| Category | Statistic | 2023 Rank | ªRank Thru 32 Races |
| Avg. Fin.¹ | 15.09 | 10th of 35 | T214th of 825 |
| Completed Laps%¹ | 96.14% | 23rd of 35 | 321st of 825 |
| Laps in Top15%¹ | 71.51% | 3rd of 35 | 127th of 781‡ |
| Avg. Driver Rating¹ | 94.43 | 3rd of 35 | 124th of 781‡ |
| Wins | 3 | T2nd of 63 | T57th of 1396 |
| Poles | 2 | T4th of 63 | T64th of 1396 |
| Top 2’s | 6 | 3rd of 63 | T56th of 1396 |
| Top 3’s | 7 | T4th of 63 | T86th of 1396 |
| Top 5’s | 13 | T1st of 63 | T38th of 1396 |
| Top 10’s | 15 | T5th of 63 | T160th of 1396 |
| DNF’s¹ | 7 | 34th of 35 | T708th of 825 |
| Stage Wins | 5 | T6th of 63 | T28th of 439* |
| Stage T10s | 39 | 3rd of 63 | T33rd of 439* |
| Stage Pts | 239 | 4th of 63 | 29th of 439* |
| Playoff Pts² | 20 | 4th of 63 | T21st of 439* |
ªSince Playoffs started in 2004
¹Ranks of drivers to start 40% of races thru 31 races
²Earned from races only, does not reflect penalties
*Stage racing started in 2017
‡Loop Data started in 2005, max Driver Rating is 150.0
- 2023 Playoff Statistics (Avg. Fin. and Driver Rating rank among drivers with 3+ Playoff starts, 35 drivers)
- 6 Races, Avg. Finish 11.0(4th), 84.46% of Laps ran in Top15, Avg. Driver Rating 107.18(1st), Best 1st, Worst 31st, Laps Completed 98.88%, Led 16.31% of laps he ran, 1 Win, 0 Poles, 2 Top 3’s, 3 Top 5’s, 3 Top 10’s, 1 Finish out of Top 20, 1 DNF, 2 Stage Wins, 9 Stage T10’s, 5.5 Stage Pts Per Stage, 7 Playoff Pts earned in races
- Notable Streaks this year
- 3 straight Top 5 finishes
- 4 straight Top 10 finishes
- 2023 Intermediate Stats (Avg. Fin. and Driver Rating rank among drivers with 1+ Intermediate start, 45 drivers)
- 8 Races, Avg. Finish 11.88(8th), 90.01% of Laps ran in Top15, Avg. Driver Rating 109.91(2nd), Best 1st, Worst 31st, Laps Completed 98.28%, Led 18.01% of laps he ran, 1 Win, 0 Poles, 3 Top 3’s, 5 Top 5’s, 5 Top 10’s, 5 Top 15’s, 2 Finishes out of Top 20, 2 DNF’s, 2 Stage Wins, 4.47 Stage Pts Per Stage
- Las Vegas Statistics
- 2023 Spring Las Vegas race
- Finished 2nd, Started 6th, Led 63 laps (23.25%), Finished 2nd in Stage 1 and 2nd in Stage 2, ran 269 Laps in Top15 (99.26% of laps he ran), had 126.3 Driver Rating (ranked 2nd)
- Notable Las Vegas Statistics (Ranks are of drivers with 1+ start this year and 1+ start at Las Vegas, 45 drivers)
- 14 Races
- 10.5 Avg. Finish (Ranks 3rd)
- Best Finish: 1st, Worst: 35th
- Completed 95.23% of laps (% ranks T28th)
- 77.68% of Laps ran in Top15 (% ranks 6th)
- 99.38 Average Driver Rating (Ranks 5th)
- Led 8.78% of laps he’s run (% ranks 5th)
- 1 Win, 7.14% (% ranks T7th)
- 5 Top 2’s, 35.71% (% ranks 1st)
- 6 Top 5’s, 42.86% (% ranks 2nd)
- 10 Top 10’s, 71.43% (% ranks 1st)
- 2 finishes outside Top 20, 14.29% (% ranks 4th)
- 1 DNF, 7.14% (% ranks T22nd)
- 2 Stage Wins, 9.09% (% ranks T4th)
- 16 Stage T10’s, 72.73% (% ranks 3rd)
- 4.82 Stage Pts Per Stage (Ranks 4th)
– Kyle Larson is notable because of his 2023 playoff stats thru 6 races
– Last week Larson started at the rear of the field but still managed to run 54% of his laps in the Top 15 en route to a 13th place finish
– After having 3 straight Top 5 finishes, he now has 3 straight finishes of 13th or worse
– His only ranks worse than T6th in the 2023 Ranks above are his 15.09 Avg. Finish (10th), 96.14 Completed Laps% (23rd), and 7 DNF’s (34th)
– Only his 3 Wins and 13 Top 5’s rank 1st or 2nd in the 2023 Ranks above
– In the 6 playoff races he has the 4th best Avg. Finish (11.0) and the best Avg. Driver Rating (107.18)
– He’s ran 84.46% of his laps in the Top 15 in the 6 races, led 16% of his laps, has 3 Top 5’s, and 9 Stage T10’s in 12 stages
– He has an 11.88 Avg. Finish in 8 Intermediate races this year with 1 Win, 3 Top 3’s, and 5 Top 5’s
– In the 8 races he’s ran 90% of his laps in the Top 15, has the 2nd best Avg. Driver Rating (109.91), and has led 18% of the laps he’s ran
– At Las Vegas this Spring Larson ran all but 2 laps in the Top 15, led 23% of the race, had the 2nd best Driver Rating (126.3), and finished 2nd
– In 14 career Cup races at Las Vegas he has a 10.5 Avg. Finish with 1 Win, just 2 finishes out of the Top 20, and more finishes in the Top 2 (5) than finishes out of the Top 10 (4)
– In these 14 races he’s ran 78% of his laps in the Top 15, led 9% of his laps, has a 99.38 Avg. Driver Rating, and has gotten 4.82 Stage Pts Per Stage
Outlook for this weekend
Larson narrowly made it into the owner Round of 8, but comfortably made it in the driver Round of 8. His 2023 Ranks above show that he is more than deserving of this spot, and his playoff stats say he’s been one of the better drivers in the playoffs. At Intermediates this year Larson has either finished really good or really bad, but at Las Vegas he’s been mostly really good. All of these stats together show that Larson most likely finishes in the Top 5 this weekend.
6th in Points – Christopher Bell (P & OP)
| Category | Statistic | 2023 Rank | ªRank Thru 32 Races |
| Avg. Fin.¹ | 13.13 | 5th of 35 | T112th of 825 |
| Completed Laps%¹ | 97.13% | 15th of 35 | 238th of 825 |
| Laps in Top15%¹ | 68.12% | 5th of 35 | 163rd of 781‡ |
| Avg. Driver Rating¹ | 90.01 | 6th of 35 | 177th of 781‡ |
| Wins | 1 | T9th of 63 | T144th of 1396 |
| Poles | 5 | 1st of 63 | T11th of 1396 |
| Top 2’s | 1 | T13th of 63 | T253rd of 1396 |
| Top 3’s | 5 | T8th of 63 | T132nd of 1396 |
| Top 5’s | 8 | T8th of 63 | T155th of 1396 |
| Top 10’s | 16 | T2nd of 63 | T127th of 1396 |
| DNF’s¹ | 3 | T6th of 35 | T266th of 825 |
| Stage Wins | 4 | T8th of 63 | T40th of 439* |
| Stage T10s | 40 | 2nd of 63 | T25th of 439* |
| Stage Pts | 215 | T5th of 63 | T46th of 439* |
| Playoff Pts² | 9 | 10th of 63 | T55th of 439* |
ªSince Playoffs started in 2004
¹Ranks of drivers to start 40% of races thru 31 races
²Earned from races only, does not reflect penalties
*Stage racing started in 2017
‡Loop Data started in 2005, max Driver Rating is 150.0
- 2023 Playoff Statistics (Avg. Fin. and Driver Rating rank among drivers with 3+ Playoff starts, 35 drivers)
- 6 Races, Avg. Finish 11.17(5th), 66.51% of Laps ran in Top15, Avg. Driver Rating 89.93(9th), Best 3rd, Worst 23rd, Laps Completed 99.94%, Led 14.9% of laps he ran, 0 Wins, 3 Poles, 1 Top 3, 2 Top 5’s, 3 Top 10’s, 1 Finish out of Top 20, 0 DNF’s, 2 Stage Wins, 8 Stage T10’s, 4.58 Stage Pts Per Stage, 2 Playoff Pts earned in races
- Notable Streaks this year
- 3 straight Poles (longest streak in Cup Series this year and tied 12th longest in Cup Series all-time)
- 2 straight Top 5 finishes
- 3 straight Top 10 finishes
- 2023 Intermediate Stats (Avg. Fin. and Driver Rating rank among drivers with 1+ Intermediate start, 45 drivers)
- 8 Races, Avg. Finish 15.13(12th), 73.54% of Laps ran in Top15, Avg. Driver Rating 88.3(10th), Best 4th, Worst 36th, Laps Completed 95.44%, Led 4.69% of laps he ran, 0 Wins, 2 Poles, 0 Top 3’s, 2 Top 5’s, 4 Top 10’s, 5 Top 15’s, 3 Finishes out of Top 20, 1 DNF, 0 Stage Wins, 3.88 Stage Pts Per Stage
- Las Vegas Statistics
- 2023 Spring Las Vegas race
- Finished 5th, Started 10th, Led 0 laps, Finished 4th in Stage 1 and 5th in Stage 2, ran 235 Laps in Top15 (86.72% of laps he ran), had 101.0 Driver Rating (ranked 8th)
- Notable Las Vegas Statistics (Ranks are of drivers with 1+ start this year and 1+ start at Las Vegas, 45 drivers)
- 7 Races
- 19.57 Avg. Finish (Ranks 18th)
- Best Finish: 5th, Worst: 34th
- Completed 90.16% of laps (% ranks 38th)
- 52.65% of Laps ran in Top15 (% ranks 16th)
- 76.2 Average Driver Rating (Ranks 15th)
- Led 1.89% of laps he’s run (% ranks 15th)
- 1 Pole, 14.29% (% ranks T1st)
- 0 Top 3’s
- 1 Top 5, 14.29% (% ranks 16th)
- 3 Top 15’s, 42.86% (% ranks 19th)
- 4 finishes outside Top 20, 57.14% (% ranks T25th)
- 1 DNF, 14.29% (% ranks T31st)
- 0 Stage Wins
- 2.14 Stage Pts Per Stage (Ranks 12th)
– Christopher Bell is notable because of his overall 2023 season stats
– At the Roval Bell ran 74% of his laps in the Top 15, got 15 Stage Pts, and finished 15th
– His longest Top 10 streak this year is only 3 races
– 11 of his 15 2023 Ranks above are T8th or better including his 13.13 Avg. Finish, 90.01 Avg. Driver Rating, 8 Top 5’s, and 215 Stage Pts
– His 5 Poles, 16 Top 10’s, and 40 Stage T10’s are all 1st or 2nd in the 2023 Ranks above; and his 5 Poles are tied for 11th most thru 32 races since 2004
– The 6 playoff races have produced an 11.17 Avg. Finish, 3 Poles, 3 Top 10’s, and only 1 finish out of the Top 20
– In the 6 races he’s ran 66.51% of his laps in the Top 15, led 15% of his laps, and he’s gotten 4.58 Stage Pts Per Stage
– At Intermediate tracks this year he has 2 Poles and 2 Top 5’s, but also 3 finishes out of the Top 20 with only 1 DNF in 8 races
– In the 8 races he’s ran 73.54% of his laps in the Top 15, has an 88.3 Avg. Driver Rating, and has led 5% of his laps
– At Las Vegas this Spring Bell ran 87% of his laps in the Top 15, had the 8th best Driver Rating (101.0), and finished 5th
– This was his 1st Top 5 in 7 career Las Vegas Cup races, and in fact he has more finishes out of the Top 20 here (4) than in the Top 15 (3)
– In his 7 races here he’s ran just 53% of his laps in the Top 15, has just a 76.2 Avg. Driver Rating, and has only gotten 2.14 Stage Pts Per Stage
Outlook for this weekend
Bell has quietly made his way to the Round of 8 this year, and his 2023 stats above show it’s deserved. Barely. His playoff stats show that he has speed but hasn’t always been able to finish it off. Still, he’s done decent just like he has in the 8 Intermediate races this year, but he’s not been spectacular. However, the opposite is true at Las Vegas as Bell has been spectacularly bad here. With this being Las Vegas I see Bell struggling to a 9th-15th place finish.
11th in Points – Bubba Wallace
| Category | Statistic | 2023 Rank | ªRank Thru 32 Races |
| Avg. Fin.¹ | 16.63 | 16th of 35 | T291st of 825 |
| Completed Laps%¹ | 98.59% | 4th of 35 | T86th of 825 |
| Laps in Top15%¹ | 60.37% | 13th of 35 | 225th of 781‡ |
| Avg. Driver Rating¹ | 79.23 | 15th of 35 | 298th of 781‡ |
| Wins | 0 | T16th of 63 | T279th of 1396 |
| Poles | 1 | T8th of 63 | T129th of 1396 |
| Top 2’s | 0 | T22nd of 63 | T396th of 1396 |
| Top 3’s | 1 | T17th of 63 | T328th of 1396 |
| Top 5’s | 5 | T14th of 63 | T241st of 1396 |
| Top 10’s | 8 | 19th of 63 | T342nd of 1396 |
| DNF’s¹ | 5 | T25th of 35 | T552nd of 825 |
| Stage Wins | 0 | T19th of 63 | T114th of 439* |
| Stage T10s | 24 | T11th of 63 | T88th of 439* |
| Stage Pts | 123 | 13th of 63 | 89th of 439* |
| Playoff Pts² | 0 | T22nd of 63 | T136th of 439* |
ªSince Playoffs started in 2004
¹Ranks of drivers to start 40% of races thru 31 races
²Earned from races only, does not reflect penalties
*Stage racing started in 2017
‡Loop Data started in 2005, max Driver Rating is 150.0
- 2023 Playoff Statistics (Avg. Fin. and Driver Rating rank among drivers with 3+ Playoff starts, 35 drivers)
- 6 Races, Avg. Finish 15.83(11th), 64.63% of Laps ran in Top15, Avg. Driver Rating 91.22(6th), Best 3rd, Worst 32nd, Laps Completed 99.71%, Led 6.91% of laps he ran, 0 Wins, 1 Pole, 1 Top 3, 1 Top 5, 2 Top 10’s, 2 Finishes out of Top 20, 0 DNF’s, 0 Stage Wins, 6 Stage T10’s, 2.75 Stage Pts Per Stage, 0 Playoff Pts earned in races
- Notable Streaks this year
- 3 straight Top 5 finishes
- 2023 Intermediate Stats (Avg. Fin. and Driver Rating rank among drivers with 1+ Intermediate start, 45 drivers)
- 8 Races, Avg. Finish 9.25(2nd), 71.0% of Laps ran in Top15, Avg. Driver Rating 98.29(5th), Best 3rd, Worst 32nd, Laps Completed 99.84%, Led 5.18% of laps he ran, 0 Wins, 1 Pole, 1 Top 3, 5 Top 5’s, 6 Top 10’s, 7 Top 15’s, 1 Finish out of Top 20, 0 DNF’s, 0 Stage Wins, 2.24 Stage Pts Per Stage
- Las Vegas Statistics
- 2023 Spring Las Vegas race
- Finished 4th, Started 13th, Led 0 laps, Finished 8th in Stage 1 and 6th in Stage 2, ran 270 Laps in Top15 (99.63% of laps he ran), had 101.6 Driver Rating (ranked 7th)
- Notable Las Vegas Statistics (Ranks are of drivers with 1+ start this year and 1+ start at Las Vegas, 45 drivers)
- 11 Races
- 22.82 Avg. Finish (Ranks 30th)
- Best Finish: 4th, Worst: 38th
- Completed 89.98% of laps (% ranks 39th)
- 23.18% of Laps ran in Top15 (% ranks 26th)
- 61.35 Average Driver Rating (Ranks 24th)
- Led 1.09% of laps he’s run (% ranks 18th)
- 0 Top 3’s
- 1 Top 5, 9.09% (% ranks 18th)
- 2 Top 15’s, 18.18% (% ranks 28th)
- 8 finishes outside Top 20, 72.73% (% ranks 33rd)
- 2 DNF’s, 18.18% (% ranks T35th)
- 1 Stage Win, 4.55% (% ranks 11th)
- 5 Stage T10’s, 22.73% (% ranks 16th)
– Bubba Wallace is notable because of his stats on Intermediate tracks this year
– Wallace started 4th at the Roval last week and got 13 Stage Pts, but he only ended up running 39.5% of his laps in the Top 15 en route to a 16th place finish
– 4 of his last 5 finishes have come out of the Top 10
– Only 2 of his 2023 Ranks above are T8th or better (98.59 Completed Laps% and 1 Pole)
– His 0 Top 2’s, 5 DNF’s, and 0 Playoff Pts all rank worse than 20th in the 2023 Ranks above
– The 6 playoff races have produced a 15.83 Avg. Finish for him with just 1 Top 5 and the same amount of finishes out of the Top 20 (2) as in the Top 10 (2)
– In the 6 races he’s ran only 65% of his laps in the Top 15, but he’s led 7% of his laps, and has the 6th best Avg. Driver Rating (91.22)
– At Intermediates this year he has the 2nd best Avg. Finish (9.25) and the 5th best Avg. Driver Rating (98.29) in 8 races
– In these 8 races he has a whopping 5 Top 5’s and only 1 finish out of the Top 20 while running 71% of his laps in the Top 15 and leading 5% of his laps
– In the Spring Las Vegas race Wallace ran all but 1 lap in the Top 15, had the 7th best Driver Rating (101.6), and finished 4th
– His 11 Cup races at Las Vegas have produced a terrible 22.82 Avg. Finish with just 1 Top 5 and 2 Top 15’s to 8 finishes out of the Top 20
– In his 11 races here he’s ran only 23% of his laps in the Top 15 and has a 61.35 Avg. Driver Rating
Outlook for this weekend
Wallace’s playoffs ended Sunday and looking at the 2023 Ranks above it was quite deserving of it to end. His playoff stats aren’t anything great either as far as finishes, but he has ran well in the 6 races. This is nothing compared to his fabulous Intermediate stats this year, but this is Las Vegas where Wallace has done quite terrible in his 11 career starts. Based on the stats I see Wallace coming home either between 5th and 10th or out of the Top 20.
12th in Points – Kyle Busch
| Category | Statistic | 2023 Rank | ªRank Thru 32 Races |
| Avg. Fin.¹ | 14.59 | 8th of 35 | T188th of 825 |
| Completed Laps%¹ | 90.73% | 32nd of 35 | 653rd of 825 |
| Laps in Top15%¹ | 57.58% | 14th of 35 | 246th of 781‡ |
| Avg. Driver Rating¹ | 81.48 | 10th of 35 | 275th of 781‡ |
| Wins | 3 | T2nd of 63 | T57th of 1396 |
| Poles | 1 | T8th of 63 | T129th of 1396 |
| Top 2’s | 5 | T4th of 63 | T70th of 1396 |
| Top 3’s | 7 | T4th of 63 | T86th of 1396 |
| Top 5’s | 9 | T5th of 63 | T122nd of 1396 |
| Top 10’s | 16 | T2nd of 63 | T127th of 1396 |
| DNF’s¹ | 6 | T31st of 35 | T636th of 825 |
| Stage Wins | 2 | T11th of 63 | T68th of 439* |
| Stage T10s | 24 | T11th of 63 | T88th of 439* |
| Stage Pts | 128 | 12th of 63 | 84th of 439* |
| Playoff Pts² | 17 | 5th of 63 | T30th of 439* |
ªSince Playoffs started in 2004
¹Ranks of drivers to start 40% of races thru 31 races
²Earned from races only, does not reflect penalties
*Stage racing started in 2017
‡Loop Data started in 2005, max Driver Rating is 150.0
- 2023 Playoff Statistics (Avg. Fin. and Driver Rating rank among drivers with 3+ Playoff starts, 35 drivers)
- 6 Races, Avg. Finish 16.67(T12th), 48.15% of Laps ran in Top15, Avg. Driver Rating 79.55(12th), Best 3rd, Worst 34th, Laps Completed 88.46%, Led 0.53% of laps he ran, 0 Wins, 0 Poles, 1 Top 3, 1 Top 5, 2 Top 10’s, 2 Finishes out of Top 20, 1 DNF, 0 Stage Wins, 3 Stage T10’s, 0.75 Stage Pts Per Stage, 0 Playoff Pts earned in races
- Notable Streaks this year
- 2 straight Top 2 finishes
- 7 straight Top 10 finishes (longest streak in Cup Series this year)
- 2023 Intermediate Stats (Avg. Fin. and Driver Rating rank among drivers with 1+ Intermediate start, 45 drivers)
- 8 Races, Avg. Finish 15.38(14th), 77.62% of Laps ran in Top15, Avg. Driver Rating 84.43(13th), Best 6th, Worst 35th, Laps Completed 87.72%, Led 0.61% of laps he ran, 0 Wins, 0 Poles, 0 Top 3’s, 0 Top 5’s, 4 Top 10’s, 6 Top 15’s, 2 Finishes out of Top 20, 2 DNF’s, 0 Stage Wins, 2.0 Stage Pts Per Stage
- Las Vegas Statistics
- 2023 Spring Las Vegas race
- Finished 14th, Started 5th, Led 0 laps, Finished 9th in Stage 1, ran 250 Laps in Top15 (92.25% of laps he ran), had 86.6 Driver Rating (ranked 10th)
- Notable Las Vegas Statistics (Ranks are of drivers with 1+ start this year and 1+ start at Las Vegas, 45 drivers)
- 24 Races
- 10.96 Avg. Finish (Ranks 4th)
- Best Finish: 1st, Worst: 41st
- Completed 93.52% of laps (% ranks 35th)
- 80.6% of Laps ran in Top15 (% ranks 4th)
- 100.75 Average Driver Rating (Ranks 3rd)
- Led 5.16% of laps he’s run (% ranks 10th)
- 1 Win, 4.17% (% ranks 10th)
- 2 Poles, 8.33% (% ranks T4th)
- 8 Top 3’s, 33.33% (% ranks 3rd)
- 11 Top 5’s, 45.83% (% ranks 1st)
- 19 Top 15’s, 79.17% (% ranks 2nd)
- 4 finishes outside Top 20, 16.67% (% ranks 5th)
- 2 DNF’s, 8.33% (% ranks T25th)
- 0 Stage Wins
- 14 Stage T10’s, 58.33% (% ranks T9th)
– Kyle Busch is notable because of his career Cup Series stats at Las Vegas
– Busch came up just shy of the Round of 8 after he ran all but 4 laps in the Top 15 and finished 3rd
– This was his best finish since the July Richmond race where he also finished 3rd
– 8 of his 15 2023 Ranks above are T8th or better including his 14.59 Avg. Finish, 3 Wins, 9 Top 5’s, and 16 Top 10’s
– His 3 stage stats above (2 Stage Wins, 24 Stage T10’s, 128 Stage Pts) all rank T11th or 12th in the 2023 Ranks above
– In the 6 playoff races he’s ran just 48% of his laps in the Top 15, led only 0.53% of his laps, and has gotten just 0.75 Stage Pts Per Stage
– These 6 races have produced a 16.67 Avg. Finish with only 1 Top 5 and the same number of Top 10’s as finishes out of the Top 20 (2)
– On Intermediate tracks this year he has a 15.38 Avg. Finish with 0 Top 5’s, but he does have 4 Top 10’s in the 8 races
– In the 8 races he’s ran 78% of his laps in the Top 15 and has a respectable 84.43 Avg. Driver Rating, but he’s only gotten 2 Stage Pts Per Stage
– This Spring at Las Vegas Busch ran 92% of his laps in the Top 15 and had the 10th best Driver Rating (86.6), but also led 0 laps and finished 14th
– He’s ran 24 career Cup races here at Las Vegas and has a 10.96 Avg. Finish with more Top 3 finishes (8) than finishes out of the Top 20 (4)
– In his 24 career races here he’s ran 81% of his laps in the Top 15, has a 10.75 Avg. Driver Rating, and the best active Top 5% (45.83%)
Outlook for this weekend
Busch came up 2 spots shy of the Round of 8 at the Roval, but based on his in-race 2023 stats he doesn’t deserve to be anyway. It’s not any better when looking at his playoff stats either as they haven’t gone well for him. The Intermediates have also not pretty for Busch, although it’s not bad either per say. The only good thing for him is he’s heading to Las Vegas where he’s been great in his career. With the stats above I see Busch ending up between 6th and 15th this weekend.
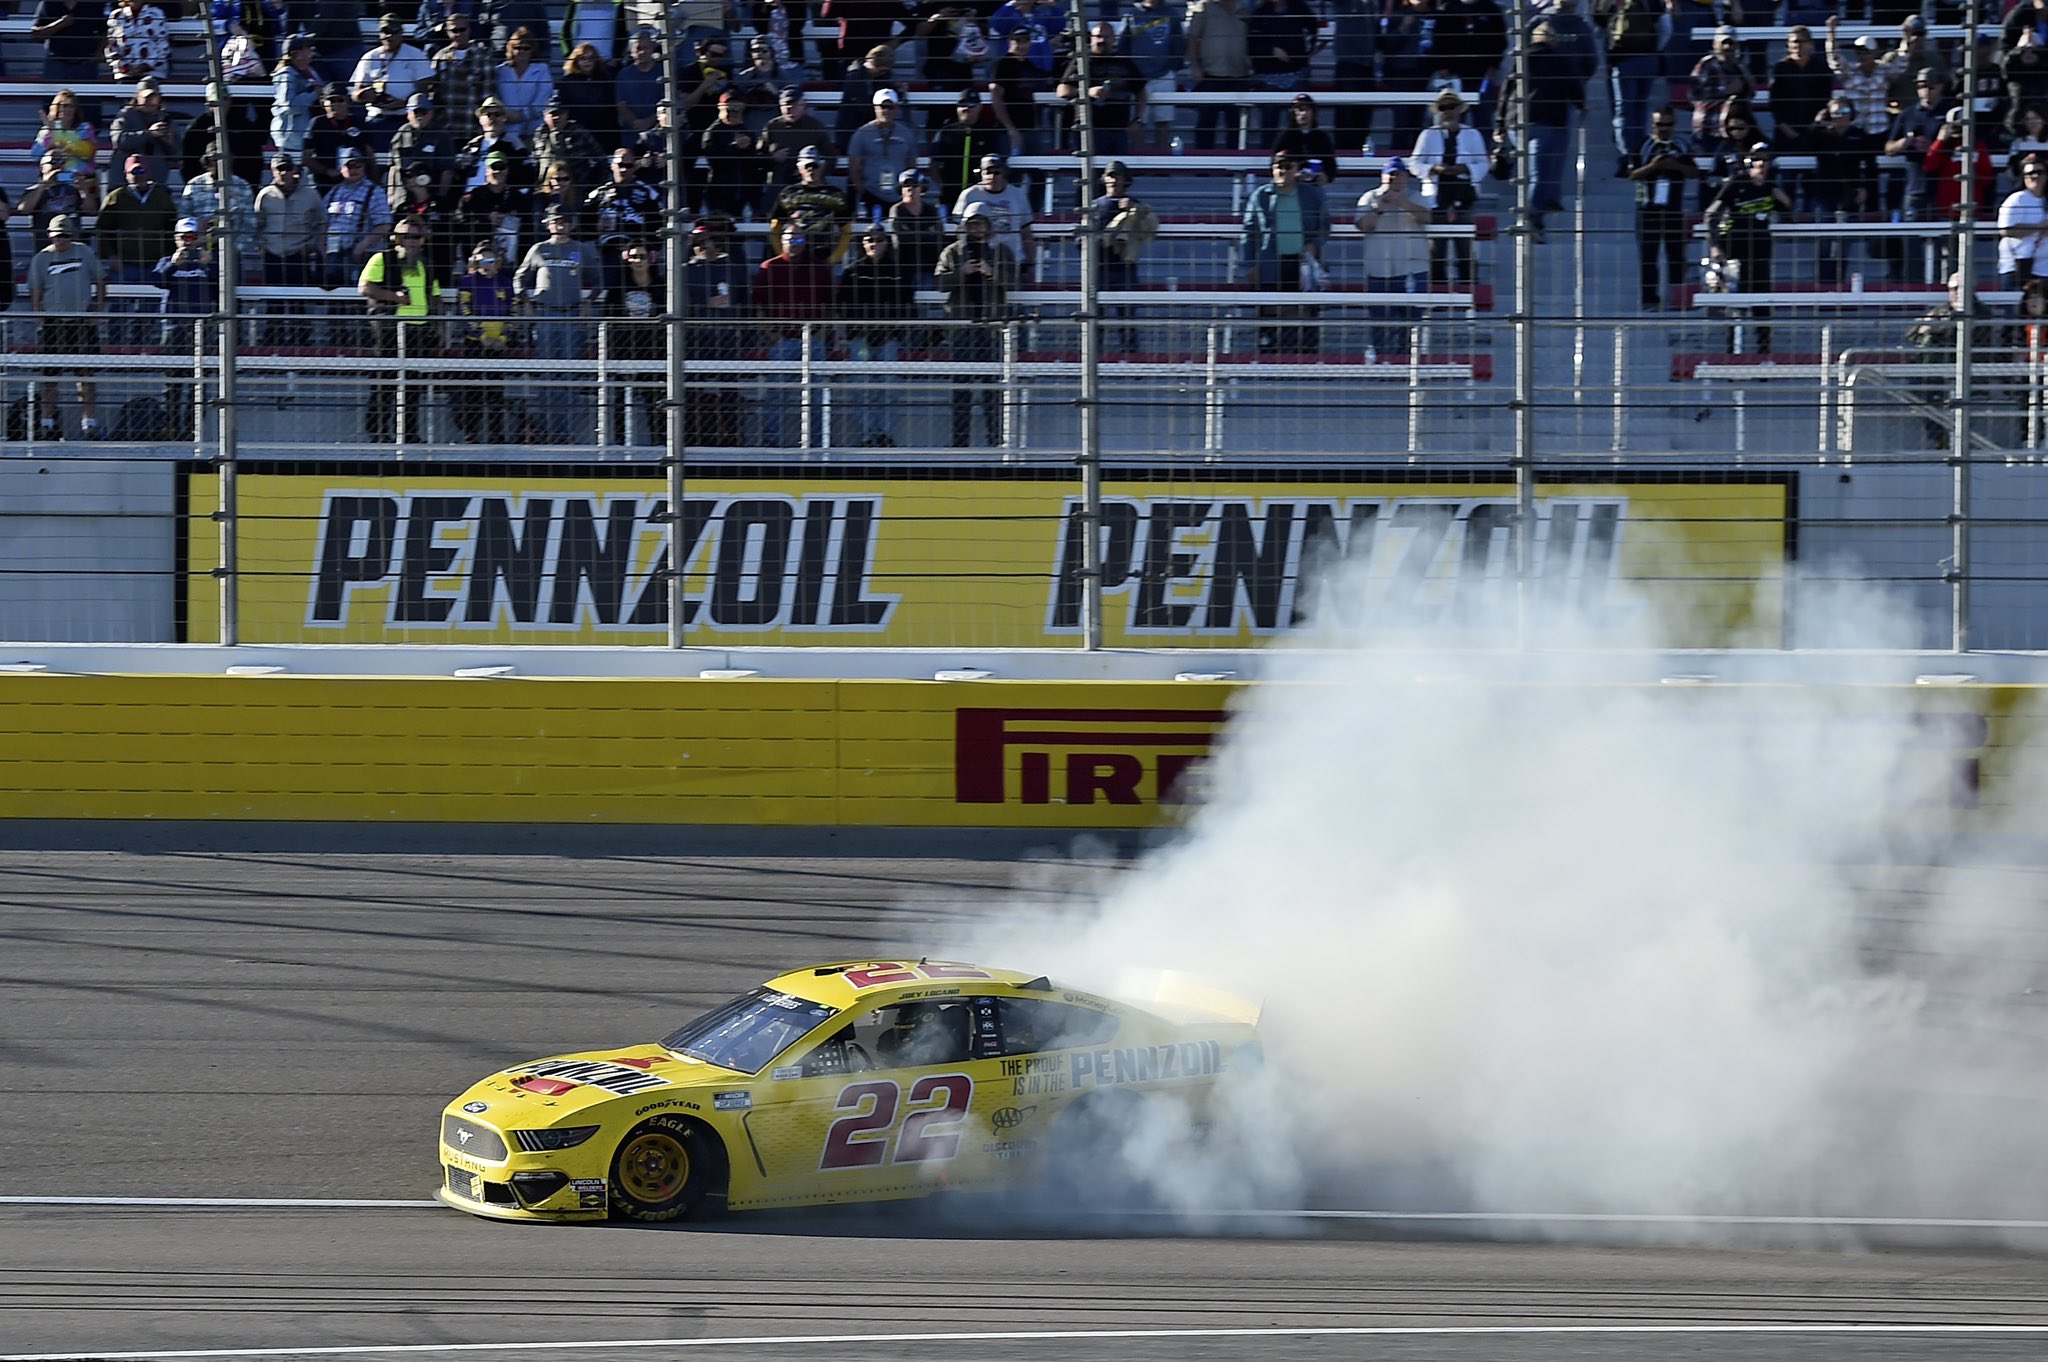
13th in Points – Joey Logano
| Category | Statistic | 2023 Rank | ªRank Thru 32 Races |
| Avg. Fin.¹ | 15.47 | 12th of 35 | T229th of 825 |
| Completed Laps%¹ | 92.22% | 30th of 35 | 594th of 825 |
| Laps in Top15%¹ | 55.77% | 15th of 35 | 262nd of 781‡ |
| Avg. Driver Rating¹ | 80.1 | 14th of 35 | 290th of 781‡ |
| Wins | 1 | T9th of 63 | T144th of 1396 |
| Poles | 2 | T4th of 63 | T64th of 1396 |
| Top 2’s | 4 | T7th of 63 | T101st of 1396 |
| Top 3’s | 6 | T6th of 63 | T105th of 1396 |
| Top 5’s | 10 | 4th of 63 | T90th of 1396 |
| Top 10’s | 15 | T5th of 63 | T160th of 1396 |
| DNF’s¹ | 5 | T25th of 35 | T552nd of 825 |
| Stage Wins | 3 | 10th of 63 | T55th of 439* |
| Stage T10s | 23 | 13th of 63 | T96th of 439* |
| Stage Pts | 136 | 10th of 63 | 79th of 439* |
| Playoff Pts² | 8 | 11th of 63 | T61st of 439* |
ªSince Playoffs started in 2004
¹Ranks of drivers to start 40% of races thru 31 races
²Earned from races only, does not reflect penalties
*Stage racing started in 2017
‡Loop Data started in 2005, max Driver Rating is 150.0
- 2023 Playoff Statistics (Avg. Fin. and Driver Rating rank among drivers with 3+ Playoff starts, 35 drivers)
- 6 Races, Avg. Finish 16.83(14th), 40.73% of Laps ran in Top15, Avg. Driver Rating 73.97(15th), Best 5th, Worst 34th, Laps Completed 85.99%, Led 3.29% of laps he ran, 0 Wins, 0 Poles, 0 Top 3’s, 2 Top 5’s, 2 Top 10’s, 3 Finishes out of Top 20, 1 DNF, 0 Stage Wins, 3 Stage T10’s, 1.17 Stage Pts Per Stage, 0 Playoff Pts earned in races
- Notable Streaks this year
- 2 straight Top 3 finishes
- 2023 Intermediate Stats (Avg. Fin. and Driver Rating rank among drivers with 1+ Intermediate start, 45 drivers)
- 8 Races, Avg. Finish 17.25(19th), 55.94% of Laps ran in Top15, Avg. Driver Rating 72.2(17th), Best 5th, Worst 36th, Laps Completed 96.39%, Led 0.72% of laps he ran, 0 Wins, 1 Pole, 0 Top 3’s, 1 Top 5, 2 Top 10’s, 3 Top 15’s, 3 Finishes out of Top 20, 1 DNF, 1 Stage Win, 1.18 Stage Pts Per Stage
- Las Vegas Statistics
- 2023 Spring Las Vegas race
- Finished 36th (DVP), Started 1st, Led 9 laps (3.32%), got 0 Stage T10’s, ran 175 Laps in Top15 (95.63% of laps he ran), had 66.1 Driver Rating (ranked 19th)
- Notable Las Vegas Statistics (Ranks are of drivers with 1+ start this year and 1+ start at Las Vegas, 45 drivers)
- 20 Races
- 9.85 Avg. Finish (Ranks 1st)
- Best Finish: 1st, Worst: 36th
- Completed 98.34% of laps (% ranks 19th)
- 81.08% of Laps ran in Top15 (% ranks 3rd)
- 101.38 Average Driver Rating (Ranks 2nd)
- Led 10.14% of laps he’s run (% ranks 2nd)
- 3 Wins, 15.0% (% ranks T2nd)
- 2 Poles, 10.0% (% ranks 3rd)
- 7 Top 5’s, 35.0% (% ranks 5th)
- 12 Top 10’s, 60.0% (% ranks T3rd)
- 17 Top 15’s, 85.0% (% ranks 1st)
- 2 finishes outside Top 20, 10.0% (% ranks 2nd)
- 1 DNF, 5.0% (% ranks 20th)
- 2 Stage Wins, 8.33% (% ranks T6th)
- 17 Stage T10’s, 70.83% (% ranks 4th)
- 4.83 Stage Pts Per Stage (Ranks 3rd)
– Joey Logano is notable because of his stats in his 20 career Cup starts at Las Vegas
– Last week Logano ran 94% of his laps in the Top 15 en route to his 10th Top 5 this year, coming home 5th
– This finish broke a string of 3 straight finishes out of the Top 20
– 8 of his 15 2023 Ranks above are 10th or better including his 2 Poles, 10 Top 5’s, 3 Stage Wins, and 136 Stage Pts
– He’s only ran 55.77% of his laps this year in the Top 15 and has just the 14th best Avg. Driver Rating in the 2023 Ranks above (80.1)
– He has a 16.83 Avg. Finish in the 6 playoff races this year with more finishes out of the Top 20 (3) than in the Top 10 (2)
– In the 6 races he’s ran a subpar 41% of his laps in the Top 15, has just a 73.97 Avg. Driver Rating, and has only gotten 1.17 Stage Pts Per Stage
– At Intermediates this year he has a 17.25 Avg. Finish with only 1 Top 5 and the same amount of Top 15’s as finishes out of the Top 20 (3) in 8 races
– In the 8 races he’s ran only 56% of his laps in the Top 15, led just 0.72% of his laps, and has an awful 1.18 Stage Pts Per Stage
– This Spring at Las Vegas Logano started on Pole and ran 96% of his laps in the Top 15, but a mid race wreck caused him to finish last in 36th
– This was his 1st DNF in 20 career Las Vegas races and in the 20 races he has the best active Avg. Finish (9.85), 3 Wins, and 12 Top 10’s
– He’s ran 81% of his laps here in the Top 15, led 10.14% of his laps here, has an impressive 101.38 Avg. Driver Rating, and his 85.0 Top 15% is best among active drivers
Outlook for this weekend
Logano has struggled to run well for most of this year and his 2023 stats show that. This hasn’t improved much since the playoffs started, and in fact has probably gotten worse. Part of the problem is Intermediates as he’s been very bad on them. One place he was good was Las Vegs, but a wreck took him out. However, good runs here for Logano are common as he’s been fantastic here in his career. Taking all this in I see a 4th-12th place finish for Logano this weekend.