
Kyle Larson – 2nd in Driver points/2nd in Owner points
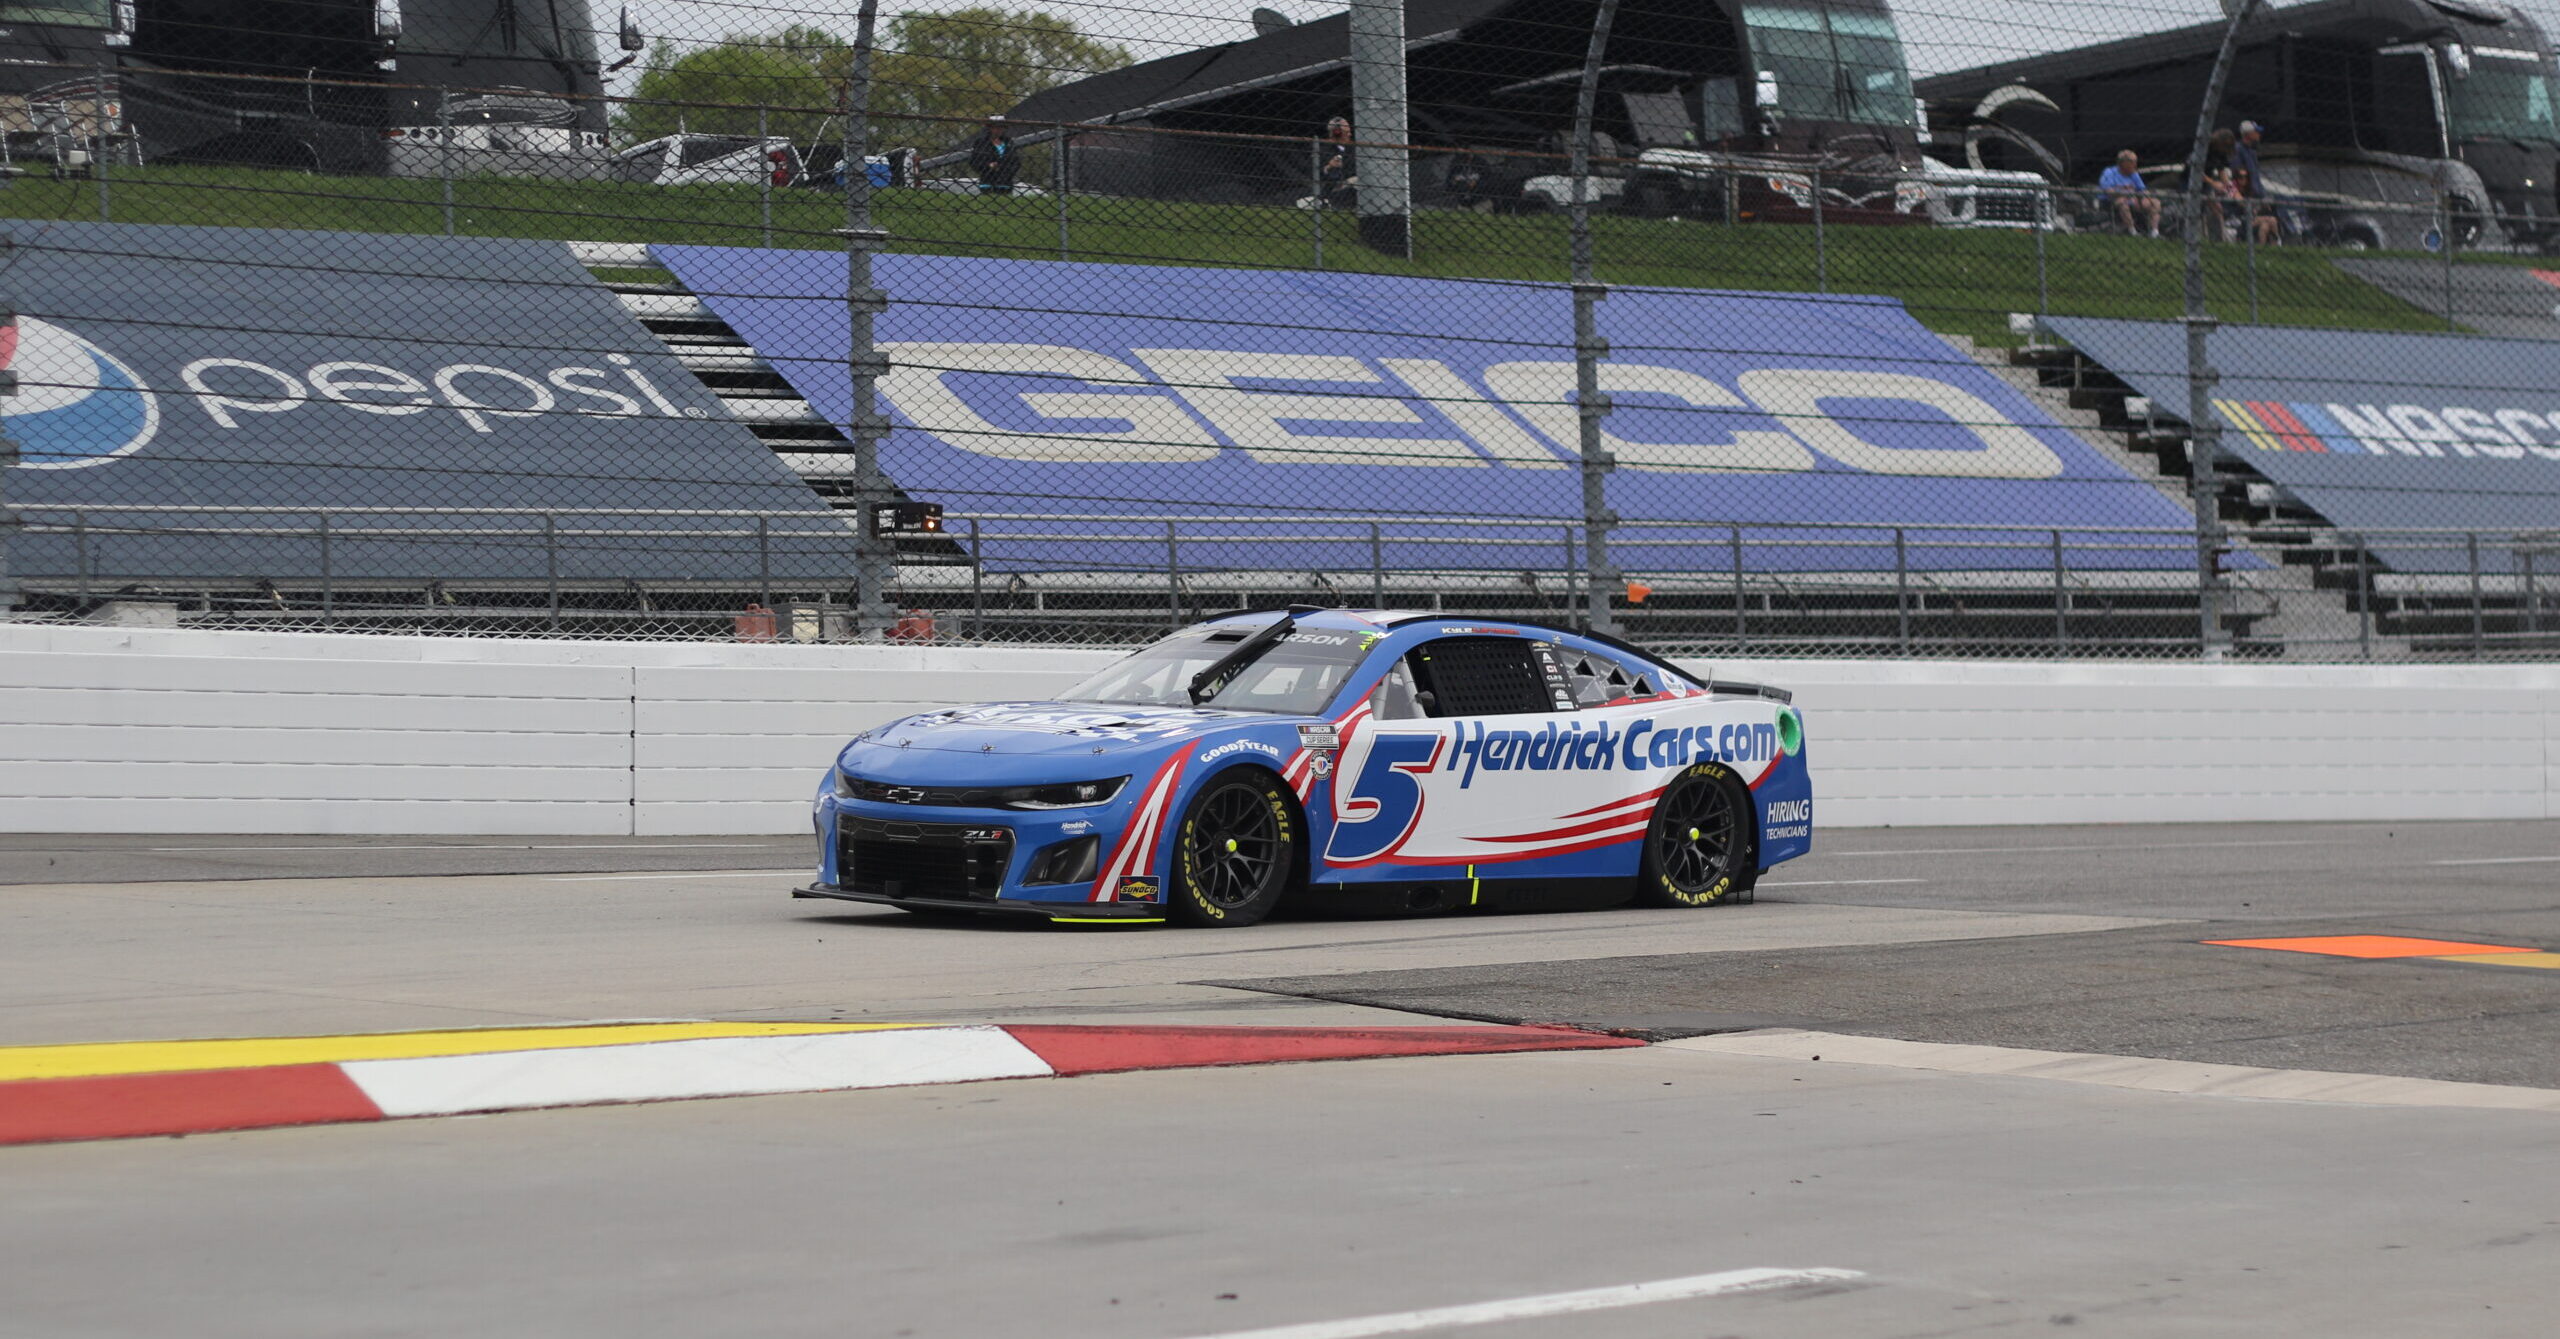
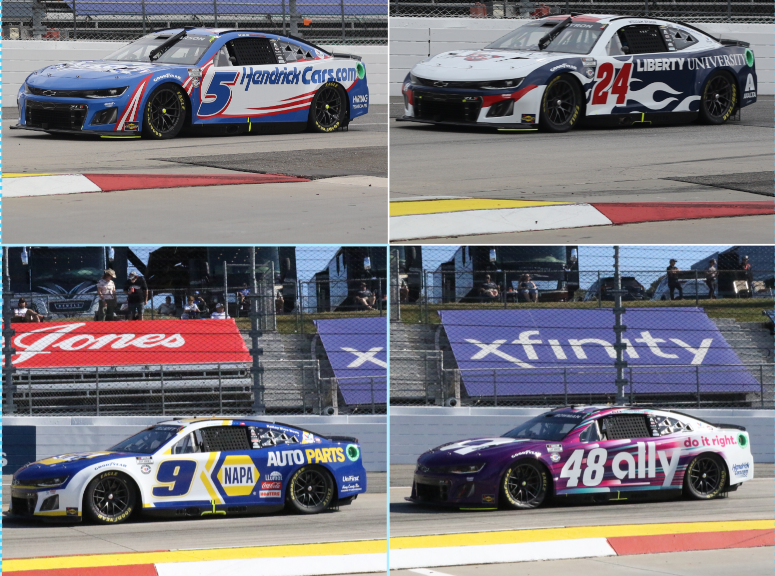
Kyle Larson finished runner-up in his third season at Hendrick Motorsports. Image credit: Andy Coffee — PPN
| Category | Statistic | 2023 Rank | ªRank Thru 36 Races |
| Avg. Fin.¹ | 14.64 | 9th of 35 | 192nd of 825 |
| Completed Laps%¹ | 96.13% | 22nd of 35 | 324th of 825 |
| Laps in Top15%¹ | 73.46% | 3rd of 35 | 114th of 781‡ |
| Avg. Driver Rating¹ | 96.77 | 3rd of 35 | 96th of 781‡ |
| Wins | 4 | 2nd of 64 | T46th of 1430 |
| Poles | 2 | T5th of 64 | T81st of 1430 |
| Top 2’s | 7 | T2nd of 64 | T52nd of 1430 |
| Top 3’s | 9 | 3rd of 64 | T57th of 1430 |
| Top 5’s | 15 | T1st of 64 | T36th of 1430 |
| Top 10’s | 18 | T4th of 64 | T130th of 1430 |
| DNF’s¹ | 8 | 34th of 35 | T714th of 825 |
| Stage Wins | 8 | T2nd of 64 | T14th of 452* |
| Stage T10s | 45 | 3rd of 64 | T30th of 452* |
| Stage Pts | 277 | 3rd of 64 | 29th of 452* |
| Playoff Pts² | 28 | 2nd of 64 | T15th of 452* |
ªSince Playoffs started in 2004
¹Ranks of drivers to start 40% of races thru 36 races
²Earned from races only, does not reflect penalties
*Stage racing started in 2017
‡Loop Data started in 2005, max Driver Rating is 150.0
2023 stats Grade: A
He had 11 of his 15 2023 Ranks be T4th or better, but he also had the 2nd most DNF’s this year. So, he gets an A instead of A+
- 2023 Playoff Statistics (Avg. Fin. and Driver Rating rank among drivers with 5+ Playoff starts, 36 drivers)
- 10 Races, Avg. Finish 11.0(3rd), 84.7% of Laps ran in Top15, Avg. Driver Rating 110.51(1st), Best 1st, Worst 34th, Laps Completed 97.64%, Led 16.92% of laps he ran, 2 Wins, 0 Poles, 4 Top 3’s, 5 Top 5’s, 6 Top 10’s, 2 Finishes out of Top 20, 2 DNF’s, 5 Stage Wins, 15 Stage T10’s, 5.2 Stage Pts Per Stage, 15 Playoff Pts earned in races
2023 Playoff Grade: A
He had the best Avg. Driver Rating and 3rd best Avg. Finish in the playoffs, but he only had 6 Top 10’s in the 10 races. Therefore, he barely misses out on an A+
- Notable Streaks this year
- 3 straight Top 5 finishes
- 2 straight Top 10 finishes (active streak)
- 4 straight Top 10 finishes
2023 Streaks Grade: B
He had 4 straight Top 10 finishes this year, but he didn’t have any Top 3 streaks which puts him at a B.
- 2023 Short track Stats (Avg. Fin. rank among drivers with 1+ Short Track start, 42 drivers)
- 5 Races, Avg. Finish 5.8(2nd), 72.77% of Laps ran in Top15, Avg. Driver Rating 102.46(2nd), Best 1st, Worst 19th, Laps Completed 100%, Led 6.5% of laps he ran, 2 Wins, 0 Poles, 3 Top 3’s, 3 Top 5’s, 4 Top 10’s, 4 Top 15’s, 0 Finishes out of Top 20, 0 DNF’s, 0 Stage Wins, 2.6 Stage Pts Per Stage
2023 Short track Grade: A+
His 2nd best Avg. Finish, 2nd best Avg. Driver Rating, 2 Wins, and 3 Top 3’s are very impressive, so he gets an A+.
- 2023 Small track Stats (Avg. Fin. rank among drivers with 1+ Small Track start, 43 drivers)
- 5 Races, Avg. Finish 9.2(T6th), 72.13% of Laps ran in Top15, Avg. Driver Rating 97.32(7th), Best 3rd, Worst 32nd, Laps Completed 97.39%, Led 13.84% of laps he ran, 0 Wins, 1 Pole, 2 Top 3’s, 4 Top 5’s, 4 Top 10’s, 4 Top 15’s, 1 Finish out of Top 20, 0 DNF’s, 1 Stage Win, 2.9 Stage Pts Per Stage
2023 Small track Grade: A
His 2.9 Stage Pts Per Stage aren’t that impressive, but his 4 Top 5’s, 13.84 Laps led%, and 9.2 Avg. Finish are impressive. So, he narrowly gets an A instead of A-.
- 2023 Intermediate Stats (Avg. Fin. rank among drivers with 1+ Intermediate Track start, 46 drivers)
- 10 Races, Avg. Finish 13.0(8th), 91.58% of Laps ran in Top15, Avg. Driver Rating 113.65(1st), Best 1st, Worst 34th, Laps Completed 96.8%, Led 22.96% of laps he ran, 2 Wins, 0 Poles, 4 Top 3’s, 6 Top 5’s, 6 Top 10’s, 6 Top 15’s, 3 Finishes out of Top 20, 3 DNF’s, 5 Stage Wins, 5.43 Stage Pts Per Stage
2023 Intermediate Grade: A-
Most of his stats above would give him an A or A+, but his Avg. Finish was only 8th best and his 6 Top 5’s were his only Top 15’s. So, bumps him down to an A-.
- 2023 Big track Stats (Avg. Fin. rank among drivers with 1+ Big Track start, 40 drivers)
- 3 Races, Avg. Finish 18.0(14th), 48.62% of Laps ran in Top15, Avg. Driver Rating 76.47(16th), Best 5th, Worst 29th, Laps Completed 97.32%, Led 4.77% of laps he ran, 0 Wins, 0 Poles, 0 Top 3’s, 1 Top 5, 1 Top 10, 1 Top 15, 1 Finish out of Top 20, 0 DNF’s, 1 Stage Win, 3.5 Stage Pts Per Stage
2023 Big track Grade: C
His Avg. Finish and Avg. Driver Rating are mediocre, but his Laps in Top 15% was bad. However, he did have 1 Top 5 and led 4.77% of his laps, so he gets a C.
- 2023 Road Course Stats (Avg. Fin. rank among drivers with 1+ Road Course start, 49 drivers)
- 6 Races, Avg. Finish 12.17(7th), 72.06% of Laps ran in Top15, Avg. Driver Rating 90.87(12th), Best 4th, Worst 26th, Laps Completed 100%, Led 0.00% of laps he ran, 0 Wins, 0 Poles, 0 Top 3’s, 1 Top 5, 3 Top 10’s, 5 Top 15’s, 1 Finish out of Top 20, 0 DNF’s, 0 Stage Wins, 3.5 Stage Pts Per Stage
2023 Road Course Grade: B
He led 0 laps on Road Courses this year, which isn’t good. However, his Avg. Finish, Avg. Driver Rating, and Top 10’s were pretty good so he gets a B.
- 2023 Superspeedway Stats (Avg. Fin. rank among drivers with 1+ Superspeedway start, 47 drivers)
- 6 Races, Avg. Finish 26.67(38th), 63.95% of Laps ran in Top15, Avg. Driver Rating 78.05(12th), Best 15th, Worst 36th, Laps Completed 88.7%, Led 1.03% of laps he ran, 0 Wins, 0 Poles, 0 Top 3’s, 0 Top 5’s, 0 Top 10’s, 1 Top 15, 4 Finishes out of Top 20, 4 DNF’s, 0 Stage Wins, 2.25 Stage Pts Per Stage
2023 Superspeedway Grade: D-
He had 4 times as many DNF’s as he did Top 15’s which is F worthy. However, his Avg. Driver Rating was 12th best which is just good enough to avoid an F and give him a D-.
- 2023 Dirt track Stats (Avg. Fin. rank among drivers with 1+ Dirt Track start, 37 drivers)
- 1 Races, Avg. Finish 35.0(35th), 87.01% of Laps ran in Top15, Avg. Driver Rating 105.5(5th), Best 35th, Worst 35th, Laps Completed 70.8%, Led 42.37% of laps he ran, 0 Wins, 1 Pole, 0 Top 3’s, 0 Top 5’s, 0 Top 10’s, 0 Top 15’s, 1 Finish out of Top 20, 1 DNF, 1 Stage Win, 9.0 Stage Pts Per Stage
2023 Dirt track Grade: D
He may have finished 35th in the Dirt race this year, but he ran extremely well in the race before wrecking out. So, he gets a good grade for his finish.
– Larson was fast at Phoenix, but not fast enough, finishing 2nd in the points
– Most of Larson’s 2023 stats were really good, but he had a lot of DNF’s
– In the playoffs he ran well, but his finishes were great or bust
– His streaks this year were sort of mediocre
– Surprisingly Short tracks were his best track style this year
– He was one of the best on Small tracks getting 4 Top 5’s in 5 races
– Larson’s run were the best on Intermediate tracks, but his finishes were boom or bust
– He ran less than half his laps in the Top 15 on Big tracks, but he did have 1 Top 5
– Despite not leading a lap on Road Courses, he actually ran and finished decent
– He was pretty much himself at Superspeedways this year, bad
– He was great at the Dirt race this year, until a wreck took him out of the race
William Byron – 3rd in Driver points/3rd in Owner points
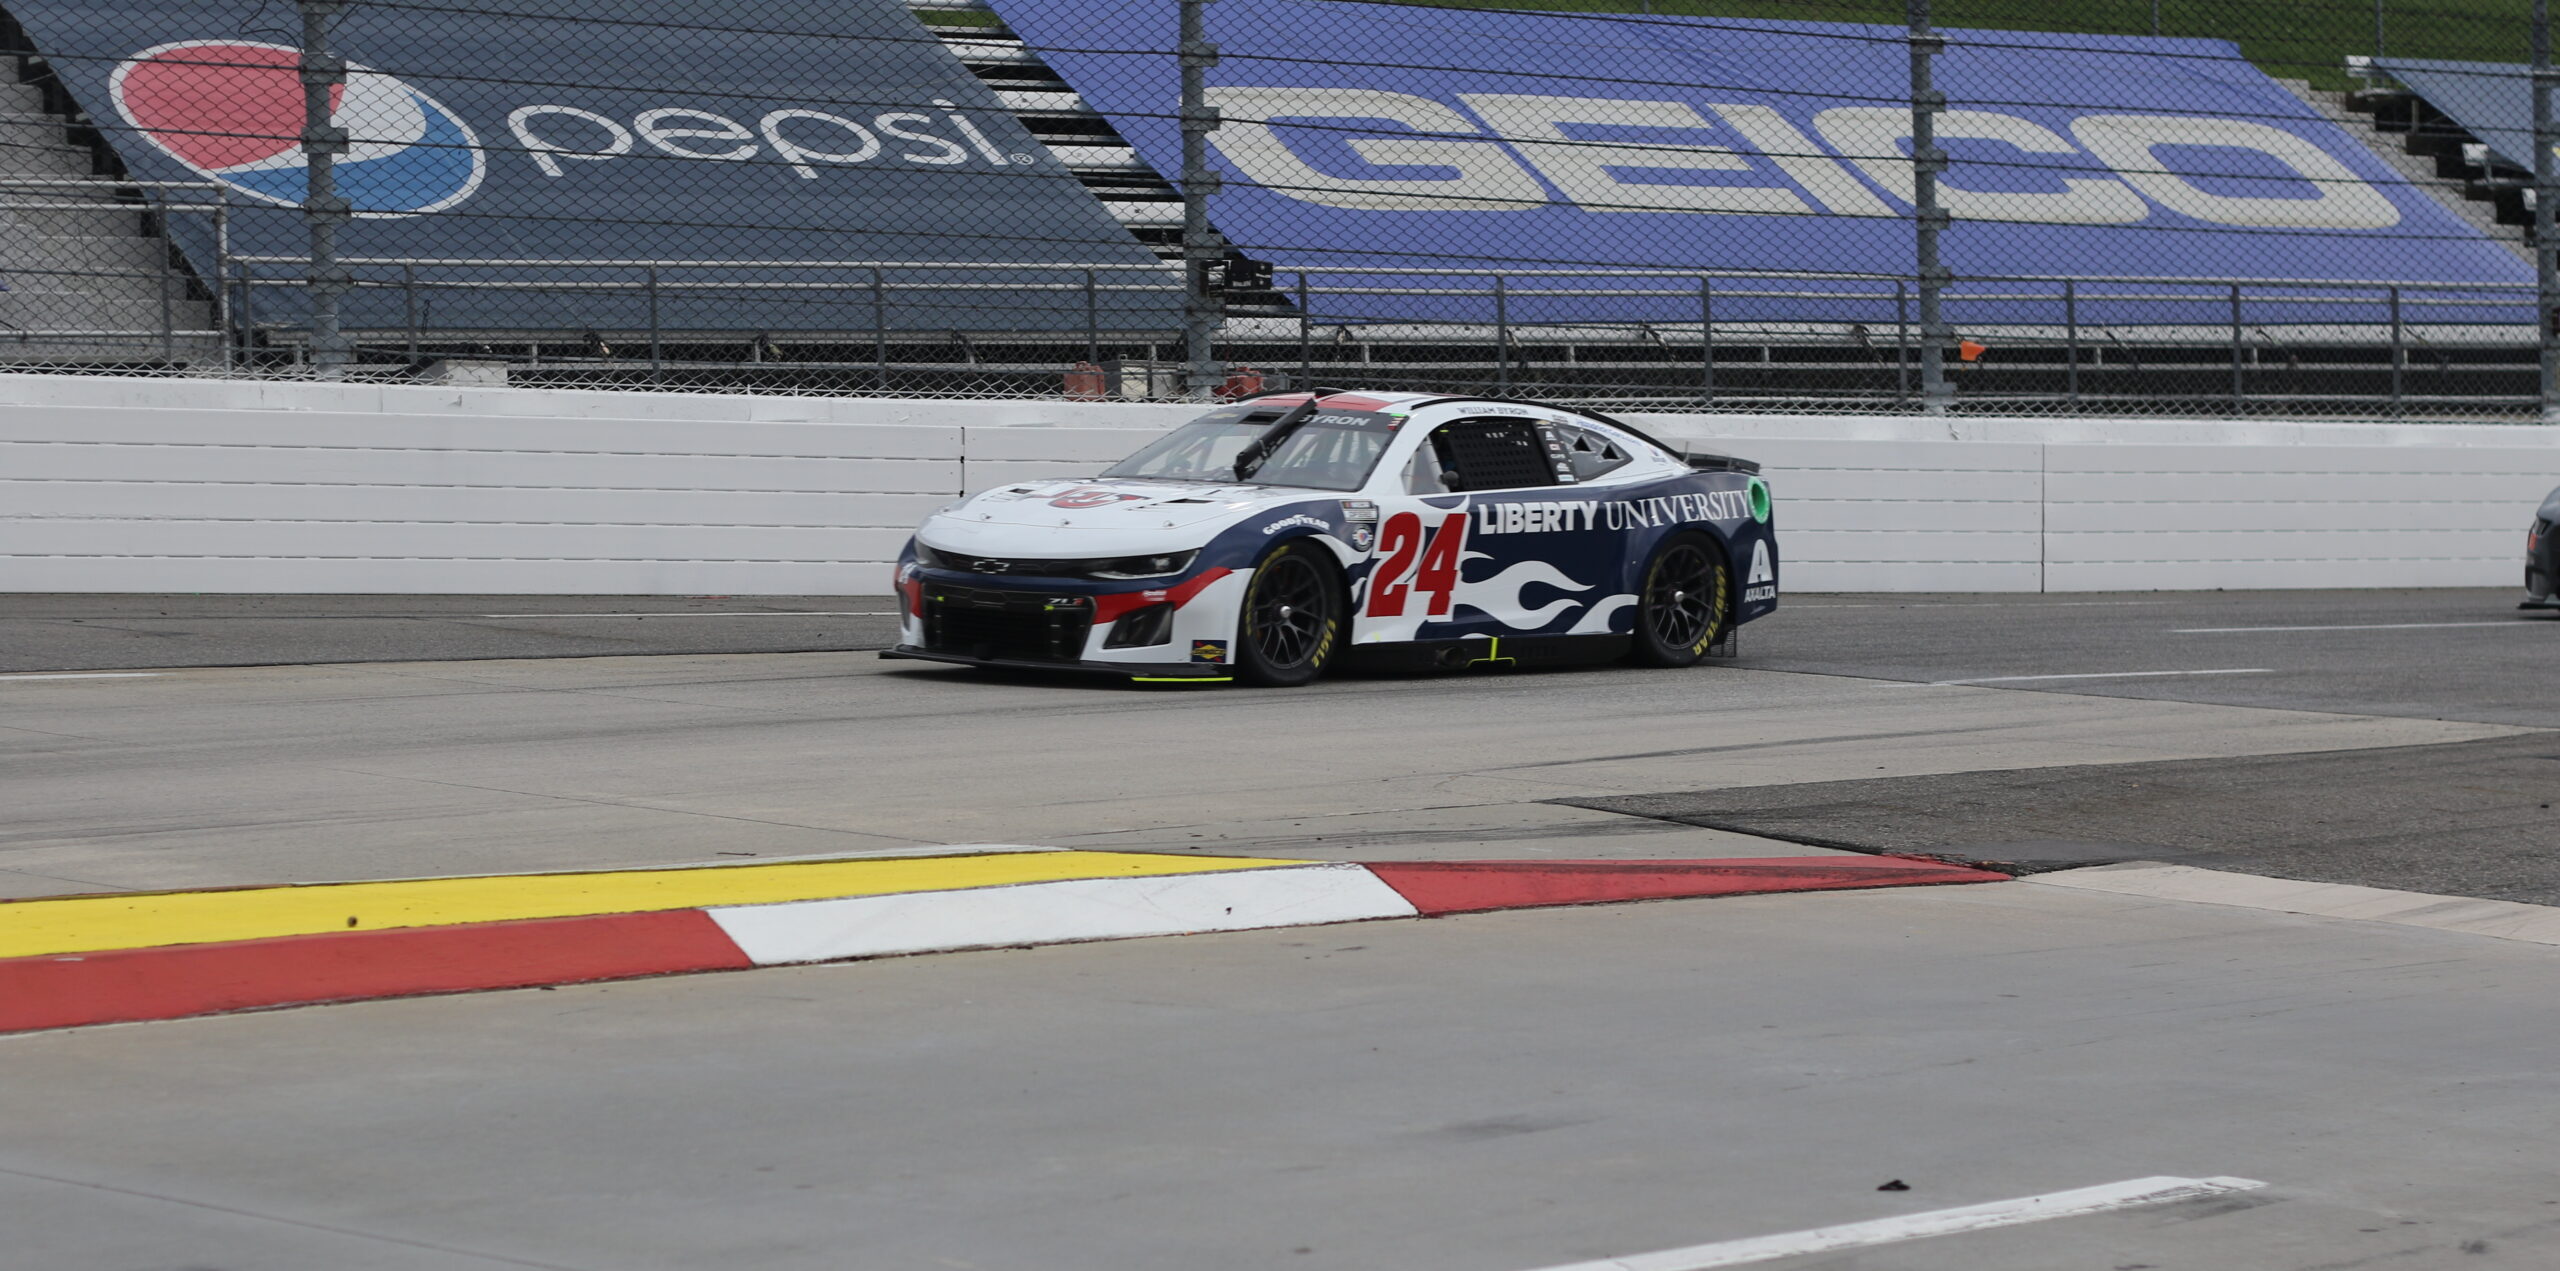
William Byron had the best season of any Hendrick driver this year, but finished 3rd in points. Image credit: Andy Coffee — PPN
| Category | Statistic | 2023 Rank | ªRank Thru 36 Races |
| Avg. Fin.¹ | 10.97 | 1st of 35 | 39th of 825 |
| Completed Laps%¹ | 97.46% | 12th of 35 | T203rd of 825 |
| Laps in Top15%¹ | 73.66% | 2nd of 35 | 110th of 781‡ |
| Avg. Driver Rating¹ | 98.75 | 1st of 35 | 71st of 781‡ |
| Wins | 6 | 1st of 64 | T16th of 1430 |
| Poles | 4 | T2nd of 64 | T22nd of 1430 |
| Top 2’s | 9 | 1st of 64 | T26th of 1430 |
| Top 3’s | 10 | 2nd of 64 | T45th of 1430 |
| Top 5’s | 15 | T1st of 64 | T36th of 1430 |
| Top 10’s | 21 | 1st of 64 | T59th of 1430 |
| DNF’s¹ | 3 | T5th of 35 | T226th of 825 |
| Stage Wins | 9 | 1st of 64 | T11th of 452* |
| Stage T10s | 44 | 4th of 64 | T34th of 452* |
| Stage Pts | 294 | 2nd of 64 | T17th of 452* |
| Playoff Pts² | 39 | 1st of 64 | T8th of 452* |
ªSince Playoffs started in 2004
¹Ranks of drivers to start 40% of races thru 36 races
²Earned from races only, does not reflect penalties
*Stage racing started in 2017
‡Loop Data started in 2005, max Driver Rating is 150.0
2023 stats Grade: A+
He had the most wins this year, the best Avg. Finish, and his stats above are pretty good since 2004 as well. So, without a doubt this is A+ stuff from Byron.
- 2023 Playoff Statistics (Avg. Fin. and Driver Rating rank among drivers with 5+ Playoff starts, 36 drivers)
- 10 Races, Avg. Finish 6.1(1st), 75.89% of Laps ran in Top15, Avg. Driver Rating 100.81(3rd), Best 1st, Worst 15th, Laps Completed 99.97%, Led 4.57% of laps he ran, 1 Win, 1 Pole, 3 Top 3’s, 6 Top 5’s, 8 Top 10’s, 0 Finishes out of Top 20, 0 DNF’s, 1 Stage Win, 12 Stage T10’s, 3.15 Stage Pts Per Stage, 6 Playoff Pts earned in races
2023 Playoff Grade: A
Even with a worst finish of 15th in the 10 playoff races, he’s getting an A instead of A+ since his Laps led% wasn’t too great and his stages were a little lackluster.
- Notable Streaks this year
- 2 straight Wins (tied longest streak in Cup Series this year)
- 3 straight Top 2 finishes (tied longest streak in Cup Series this year)
- 3 straight Top 3 finishes (tied longest streak in Cup Series this year)
- 4 straight Top 5 finishes (tied longest streak in Cup Series this year)
- 6 straight Top 10 finishes
2023 Streaks Grade: A+
His streaks speak for themselves as he was tied for the longest streak in almost every category.
- 2023 Short track Stats (Avg. Fin. rank among drivers with 1+ Short Track start, 42 drivers)
- 5 Races, Avg. Finish 18.0(24th), 61.37% of Laps ran in Top15, Avg. Driver Rating 85.38(11th), Best 9th, Worst 24th, Laps Completed 99.91%, Led 5.32% of laps he ran, 0 Wins, 0 Poles, 0 Top 3’s, 0 Top 5’s, 1 Top 10, 2 Top 15’s, 3 Finishes out of Top 20, 0 DNF’s, 1 Stage Win, 3.3 Stage Pts Per Stage
2023 Short track Grade: C+
I wanted to give him a B based on the fact his Avg. Driver Rating was decent and his stages plus laps led were good, but having just 1 Top 10 causes him to have a C+
- 2023 Small track Stats (Avg. Fin. rank among drivers with 1+ Small Track start, 43 drivers)
- 5 Races, Avg. Finish 8.2(3rd), 91.93% of Laps ran in Top15, Avg. Driver Rating 113.74(1st), Best 1st, Worst 24th, Laps Completed 100%, Led 24.86% of laps he ran, 1 Win, 1 Pole, 1 Top 3, 3 Top 5’s, 4 Top 10’s, 4 Top 15’s, 1 Finish out of Top 20, 0 DNF’s, 3 Stage Wins, 5.8 Stage Pts Per Stage
2023 Small track Grade: A+
He has all the stats you’d need above for an A+ except maybe a few more Top 3’s and a better Laps in Top15%, but his 25% of laps led makes up for any little bit lacking.
- 2023 Intermediate Stats (Avg. Fin. rank among drivers with 1+ Intermediate Track start, 46 drivers)
- 10 Races, Avg. Finish 4.4(1st), 82.45% of Laps ran in Top15, Avg. Driver Rating 112.13(2nd), Best 1st, Worst 15th, Laps Completed 100%, Led 10.81% of laps he ran, 3 Wins, 1 Pole, 5 Top 3’s, 7 Top 5’s, 9 Top 10’s, 10 Top 15’s, 0 Finishes out of Top 20, 0 DNF’s, 3 Stage Wins, 5.05 Stage Pts Per Stage
2023 Intermediate Grade: A+
He had the 2nd best Avg. Driver Rating, led 11% of his laps, and finished half the Intermediate races in the Top 3. So, duh A+.
- 2023 Big track Stats (Avg. Fin. rank among drivers with 1+ Big Track start, 40 drivers)
- 3 Races, Avg. Finish 24.67(28th), 81.19% of Laps ran in Top15, Avg. Driver Rating 83.57(9th), Best 14th, Worst 35th, Laps Completed 72.14%, Led 14.85% of laps he ran, 0 Wins, 1 Pole, 0 Top 3’s, 0 Top 5’s, 0 Top 10’s, 1 Top 15, 2 Finishes out of Top 20, 1 DNF, 0 Stage Wins, 2.17 Stage Pts Per Stage
2023 Big track Grade: C
His finishes give him a D range grade, but he ran so well that it’s hard to give him a D. However, 0 Top 10’s can’t be better than a regular C, so that’s what he gets.
- 2023 Road Course Stats (Avg. Fin. rank among drivers with 1+ Road Course start, 49 drivers)
- 6 Races, Avg. Finish 8.17(3rd), 70.96% of Laps ran in Top15, Avg. Driver Rating 101.83(3rd), Best 1st, Worst 14th, Laps Completed 100%, Led 17.28% of laps he ran, 1 Win, 1 Pole, 2 Top 3’s, 3 Top 5’s, 3 Top 10’s, 6 Top 15’s, 0 Finishes out of Top 20, 0 DNF’s, 2 Stage Wins, 3.0 Stage Pts Per Stage
2023 Road Course Grade: A-
He had the 3rd best Avg. Finish and Avg. Driver Rating which is impressive. However, only half his finishes were in the Top 10 so I decided he gets an A-.
- 2023 Superspeedway Stats (Avg. Fin. rank among drivers with 1+ Superspeedway start, 47 drivers)
- 6 Races, Avg. Finish 14.0(11th), 58.7% of Laps ran in Top15, Avg. Driver Rating 81.5(8th), Best 1st, Worst 34th, Laps Completed 93.52%, Led 2.93% of laps he ran, 1 Win, 0 Poles, 2 Top 3’s, 2 Top 5’s, 4 Top 10’s, 4 Top 15’s, 2 Finishes out of Top 20, 2 DNF’s, 0 Stage Wins, 3.92 Stage Pts Per Stage
2023 Superspeedway Grade: B+
His Avg. Finish and Avg. Driver Rating were pretty good, but his Laps in Top 15% was pretty bad. However, he had 4 Top 10’s and a win, so he gets a B+.
- 2023 Dirt track Stats (Avg. Fin. rank among drivers with 1+ Dirt Track start, 37 drivers)
- 1 Races, Avg. Finish 13.0(13th), 92.8% of Laps ran in Top15, Avg. Driver Rating 87.5(9th), Best 13th, Worst 13th, Laps Completed 100%, Led 0.00% of laps he ran, 0 Wins, 0 Poles, 0 Top 3’s, 0 Top 5’s, 0 Top 10’s, 1 Top 15, 0 Finishes out of Top 20, 0 DNF’s, 0 Stage Wins, 0.5 Stage Pts Per Stage
2023 Dirt track Grade: B
He finished 13th after running most of the race in the Top 15 at the Dirt race, but he only got 0.5 Stage Pts Per Stage which hurt his grade.
– Through 100 laps at Phoenix Byron was the championship favorite, but he ended up 3rd
– His 2023 stats are the best of anyone this year
– Just like the 2023 stats, his playoff stats were incredible as well
– He basically is tied best in every streak this year
– As much as he struggled to run well at Short tracks, his finishes were even worse
– He was one of the best, if not the best, drivers on Small tracks this year
– Byron was hands down the best driver on Intermediates
– Big tracks were a struggle for Byron to finish well on, even though he ran pretty good
– He was one of the better drivers on Road Courses this year, but struggled to run Top 15
– He finished pretty good on Superspeedways this year, but didn’t always run well
– He ran good enough for a Top 15 finish at the Dirt track this year
Chase Elliott – 17th in Driver points/10th in Owner points
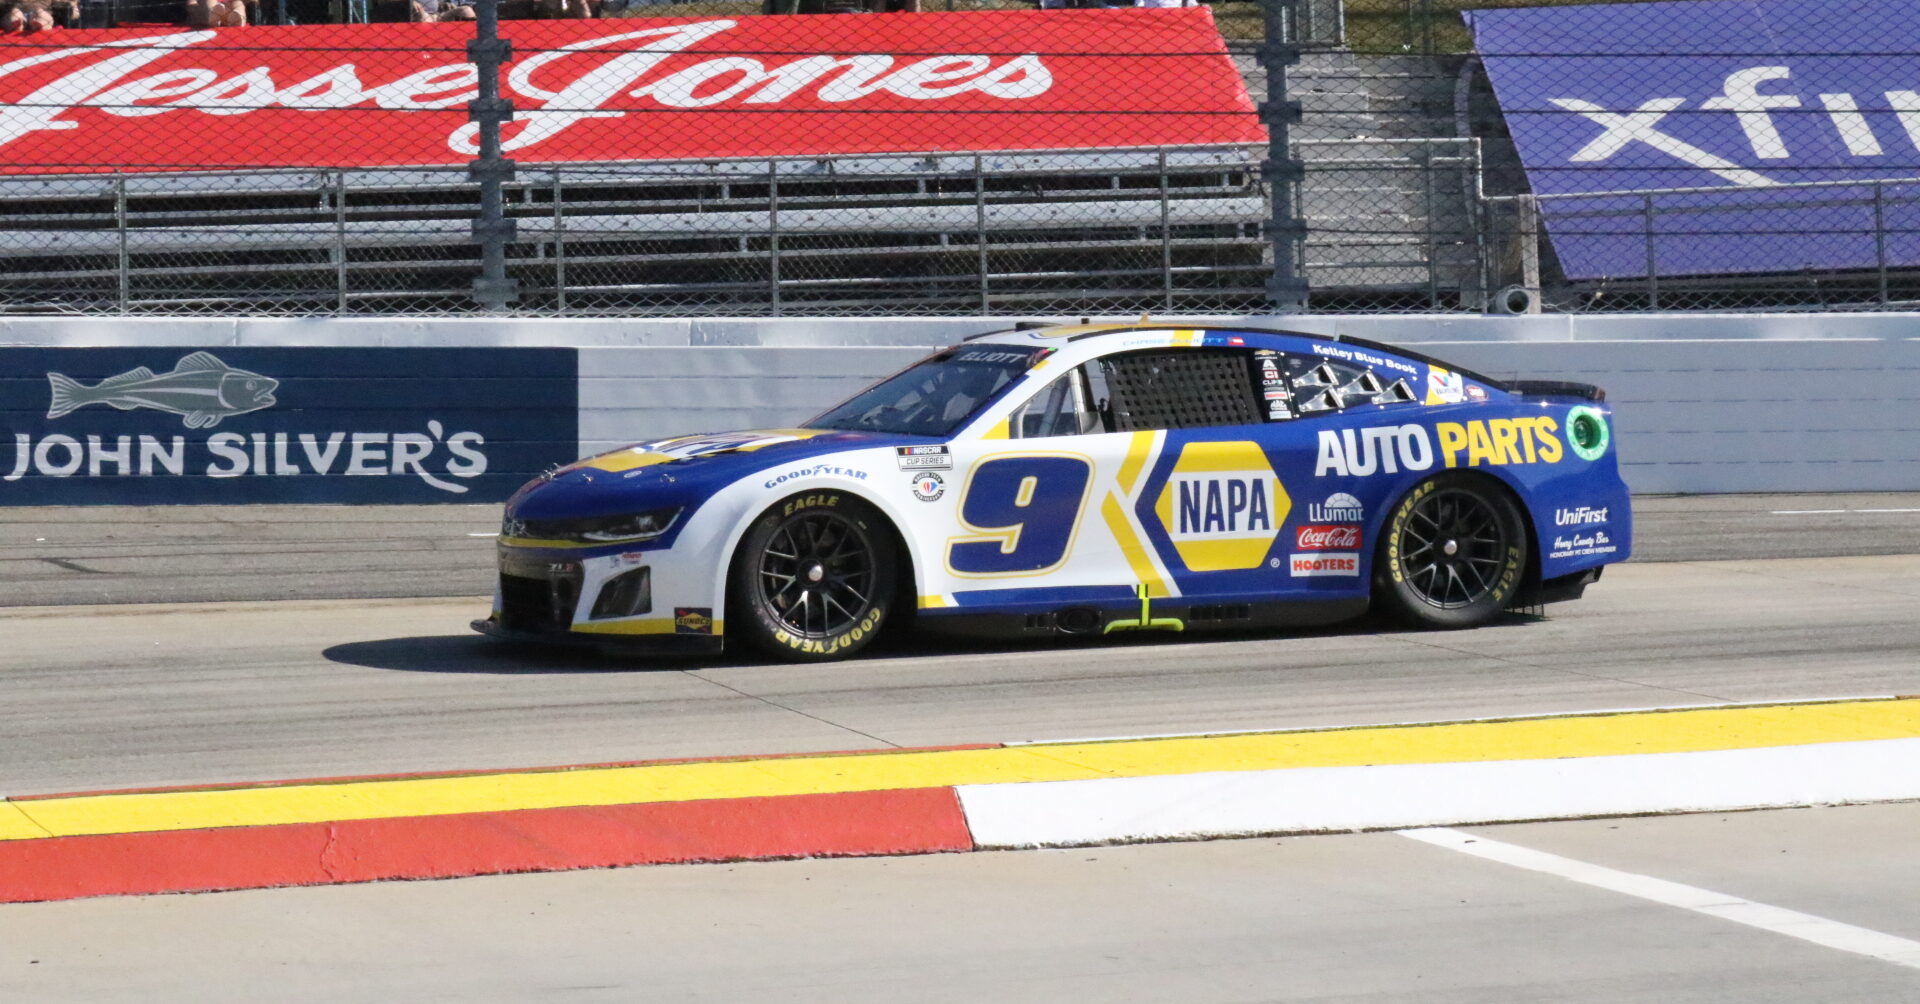
Chase Elliott ran only 29 of 36 races this year due to injury/suspension. Image credit: Andy Coffee — PPN
| Category | Statistic | 2023 Rank | ªRank Thru 36 Races |
| Avg. Fin.¹ | 13.07 | 5th of 35 | 114th of 825 |
| Completed Laps%¹ | 93.61% | 27th of 35 | T535th of 825 |
| Laps in Top15%¹ | 61.69% | 10th of 35 | 219th of 781‡ |
| Avg. Driver Rating¹ | 82.5 | 9th of 35 | 261st of 781‡ |
| Wins | 0 | T16th of 64 | T288th of 1430 |
| Poles | 0 | T16th of 64 | T282nd of 1430 |
| Top 2’s | 2 | T12th of 64 | T194th of 1430 |
| Top 3’s | 4 | T12th of 64 | T190th of 1430 |
| Top 5’s | 7 | T12th of 64 | T205th of 1430 |
| Top 10’s | 15 | 12th of 64 | T211th of 1430 |
| DNF’s¹ | 3 | T5th of 35 | T226th of 825 |
| Stage Wins | 2 | T11th of 64 | T70th of 452* |
| Stage T10s | 22 | T15th of 64 | T107th of 452* |
| Stage Pts | 116 | 14th of 64 | 97th of 452* |
| Playoff Pts² | 2 | 17th of 64 | T108th of 452* |
ªSince Playoffs started in 2004
¹Ranks of drivers to start 40% of races thru 36 races
²Earned from races only, does not reflect penalties
*Stage racing started in 2017
‡Loop Data started in 2005, max Driver Rating is 150.0
2023 stats Grade: B-
If he won he’d have a B or B+, but he didn’t. However, his Avg. Finish was really good and for only having run 29 races his stats are really good.
- 2023 Playoff Statistics (Avg. Fin. and Driver Rating rank among drivers with 5+ Playoff starts, 36 drivers)
- 10 Races, Avg. Finish 12.8(8th), 62.13% of Laps ran in Top15, Avg. Driver Rating 82.44(10th), Best 6th, Worst 32nd, Laps Completed 99.93%, Led 5.06% of laps he ran, 0 Wins, 0 Poles, 0 Top 3’s, 0 Top 5’s, 5 Top 10’s, 1 Finish out of Top 20, 0 DNF’s, 1 Stage Win, 10 Stage T10’s, 2.6 Stage Pts Per Stage, 1 Playoff Pt earned in races
2023 Playoff Grade: C+
His Avg. Finish and Avg. Driver Rating are B worthy, but he didn’t run enough laps in the Top 15 and he didn’t get a single Top 5 in the 10 playoff races. Therefore, he gets a C+.
- Notable Streaks this year
- 3 straight Top 5 finishes
- 4 straight Top 10 finishes
2023 Streaks Grade: B
He did have pretty good Top 5 and Top 10 streaks, but having no Top 3 streaks hurts him. So, he gets a B.
- 2023 Short track Stats (Avg. Fin. rank among drivers with 1+ Short Track start, 42 drivers)
- 4 Races, Avg. Finish 11.75(9th), 68.93% of Laps ran in Top15, Avg. Driver Rating 83.5(15th), Best 7th, Worst 17th, Laps Completed 99.94%, Led 4.61% of laps he ran, 0 Wins, 0 Poles, 0 Top 3’s, 0 Top 5’s, 2 Top 10’s, 3 Top 15’s, 0 Finishes out of Top 20, 0 DNF’s, 0 Stage Wins, 1.0 Stage Pts Per Stage
2023 Short track Grade: B-
He had 2 Top 10’s in 4 Short track races and a worst finish of 17th, but only had the 15th best Avg. Driver Rating and got just 1 Stage Pt Per Stage. So he gets a B- for being just above average.
- 2023 Small track Stats (Avg. Fin. rank among drivers with 1+ Small Track start, 43 drivers)
- 3 Races, Avg. Finish 13.0(T9th), 45.61% of Laps ran in Top15, Avg. Driver Rating 71.03(19th), Best 11th, Worst 16th, Laps Completed 100%, Led 0.00% of laps he ran, 0 Wins, 0 Poles, 0 Top 3’s, 0 Top 5’s, 0 Top 10’s, 2 Top 15’s, 0 Finishes out of Top 20, 0 DNF’s, 0 Stage Wins, 0.33 Stage Pts Per Stage
2023 Small track Grade: C
He had a pretty good Avg. Finish, but he scored 0 Top 10’s in 3 starts and his Laps in Top 15% plus Avg. Driver Rating were pretty bad. Thus, he gets a C for average.
- 2023 Intermediate Stats (Avg. Fin. rank among drivers with 1+ Intermediate Track start, 46 drivers)
- 9 Races, Avg. Finish 13.33(10th), 70.83% of Laps ran in Top15, Avg. Driver Rating 80.49(13th), Best 3rd, Worst 34th, Laps Completed 91.99%, Led 2.42% of laps he ran, 0 Wins, 0 Poles, 1 Top 3, 2 Top 5’s, 5 Top 10’s, 7 Top 15’s, 2 Finishes out of Top 20, 1 DNF, 0 Stage Wins, 1.74 Stage Pts Per Stage
2023 Intermediate Grade: C+
This was hard to decided C+ or B- as he ran decent and finished over half his races in the Top 10, but only 1.74 Stage Pts Per Stage. I ended up going with C+ based on just 2 Top 5’s and his Laps in Top 15%.
- 2023 Big track Stats (Avg. Fin. rank among drivers with 1+ Big Track start, 40 drivers)
- 3 Races, Avg. Finish 16.0(12th), 74.37% of Laps ran in Top15, Avg. Driver Rating 78.17(14th), Best 2nd, Worst 36th, Laps Completed 70.36%, Led 0.25% of laps he ran, 0 Wins, 0 Poles, 1 Top 3, 1 Top 5, 2 Top 10’s, 2 Top 15’s, 1 Finish out of Top 20, 1 DNF, 0 Stage Wins, 0.83 Stage Pts Per Stage
2023 Big track Grade: B-
He was pretty average on Big tracks this year, but gets a little better than average grade based on the fact he got 1 Top 3 and 2 Top 10’s in 3 races
- 2023 Road Course Stats (Avg. Fin. rank among drivers with 1+ Road Course start, 49 drivers)
- 5 Races, Avg. Finish 10.2(5th), 73.72% of Laps ran in Top15, Avg. Driver Rating 96.4(7th), Best 2nd, Worst 32nd, Laps Completed 99.79%, Led 4.91% of laps he ran, 0 Wins, 0 Poles, 2 Top 3’s, 3 Top 5’s, 4 Top 10s, 4 Top 15’s, 1 Finish out of Top 20, 0 DNF’s, 1 Stage Win, 3.2 Stage Pts Per Stage
2023 Road Course Grade: B+
He had the 5th best Avg. Finish and 4 Top 10’s while getting 3.2 Stage Pts Per Stage on Road Courses. However, his Avg. Driver Rating is only 7th best with just 74% of his laps being run in the Top 15.
- 2023 Superspeedway Stats (Avg. Fin. rank among drivers with 1+ Superspeedway start, 47 drivers)
- 5 Races, Avg. Finish 14.8(12th), 61.06% of Laps ran in Top15, Avg. Driver Rating 80.88(9th), Best 4th, Worst 38th, Laps Completed 90.04%, Led 3.29% of laps he ran, 0 Wins, 0 Poles, 0 Top 3’s, 1 Top 5, 2 Top 10’s, 4 Top 15’s, 1 Finish out of Top 20, 1 DNF, 1 Stage Win, 3.6 Stage Pts Per Stage
2023 Superspeedway Grade: B
He only had 1 Top 5 with just 61% of his laps run in the Top 15. However, his Avg. Driver Rating and Avg. Finish are pretty good so I left him with a B.
- 2023 Dirt track Stats (Avg. Fin. rank among drivers with 1+ Dirt Track start, 37 drivers)
- 0 Races
2023 Dirt track Grade: Incomplete
He did not race in the one Dirt race this year due to an injury.
– After an Injury held Elliott out this year he ended up 17th in points, but the 9 car ended up 10th in owner points
– In 7 fewer races he had more Top 5’s than playoff drivers Bubba Wallace and Kevin Harvick
– In 7 fewer races he had more Top 10’s than playoff drivers Bubba Wallace, Kevin Harvick, and Ross Chastain
– He got 0 Top 5’s in the playoffs, but still ran decent and got 5 Top 10’s
– His best Top 10 streak was only 4 races this year
– He didn’t run great at Short tracks this year, but found a way to finish well in them
– He got 0 Top 10’s in 3 Small track races and ran less than half his laps in the Top 15
– Intermediate races were decent for Elliott and he finished most of them in the Top 10
– At Big tracks he got less than 1 Stage Pt Per Stage, but did end up with 2 Top 10’s in the 3 races
– As expected he did very well on Road Courses this year getting over half his Top 5’s here
– Superspeedways were a pretty good track for him, just not Top 5 wise
– He didn’t race in the Dirt race this year
Alex Bowman – 20th in Driver points/20th in Owner points
Alex Bowman ran only 33 of 36 races due to injury. Image credit: Andy Coffee — PPN
| Category | Statistic | 2023 Rank | ªRank Thru 36 Races |
| Avg. Fin.¹ | 17.15 | 16th of 35 | 309th of 825 |
| Completed Laps%¹ | 96.65% | 19th of 35 | T271st of 825 |
| Laps in Top15%¹ | 57.02% | 14th of 35 | 251st of 781‡ |
| Avg. Driver Rating¹ | 76.61 | 17th of 35 | 326th of 781‡ |
| Wins | 0 | T16th of 64 | T288th of 1430 |
| Poles | 1 | T9th of 64 | T143rd of 1430 |
| Top 2’s | 0 | T18th of 64 | T403rd of 1430 |
| Top 3’s | 2 | T13th of 64 | T271st of 1430 |
| Top 5’s | 4 | T16th of 64 | T291st of 1430 |
| Top 10’s | 10 | T15th of 64 | T314th of 1430 |
| DNF’s¹ | 4 | T14th of 35 | T359th of 825 |
| Stage Wins | 0 | T19th of 64 | T114th of 452* |
| Stage T10s | 20 | 18th of 64 | T112th of 452* |
| Stage Pts | 105 | 17th of 64 | 106th of 452* |
| Playoff Pts² | 0 | T22nd of 64 | T136th of 452* |
ªSince Playoffs started in 2004
¹Ranks of drivers to start 40% of races thru 36 races
²Earned from races only, does not reflect penalties
*Stage racing started in 2017
‡Loop Data started in 2005, max Driver Rating is 150.0
2023 stats Grade: C
He had just the 16th best Avg. Finish this year and even with missing less races his stats are overall worse than Chase Elliott. Hence a worse grade than Elliott with a C.
- 2023 Playoff Statistics (Avg. Fin. and Driver Rating rank among drivers with 5+ Playoff starts, 36 drivers)
- 10 Races, Avg. Finish 20.7(22nd), 41.31% of Laps ran in Top15, Avg. Driver Rating 68.39(18th), Best 8th, Worst 35th, Laps Completed 94.32%, Led 0.49% of laps he ran, 0 Wins, 0 Poles, 0 Top 3’s, 0 Top 5’s, 2 Top 10’s, 4 Finishes out of Top 20, 2 DNF’s, 0 Stage Wins, 1 Stage T10, 0.3 Stage Pts Per Stage, 0 Playoff Pts earned in races
2023 Playoff Grade: D+
The playoff stats above for him are terrible for a Hendrick driver as he had more finishes out of the Top 20 than in the Top 10, and he didn’t run well in the races either.
- Notable Streaks this year
- 4 straight Top 10 finishes
2023 Streaks Grade: C
He only had 2 streaks longer than 1 straight Top 10 and his longest was only 4 races. That’s a nice streak, but not good, just average.
- 2023 Short track Stats (Avg. Fin. rank among drivers with 1+ Short Track start, 42 drivers)
- 5 Races, Avg. Finish 16.4(19th), 66.97% of Laps ran in Top15, Avg. Driver Rating 77.02(19th), Best 8th, Worst 32nd, Laps Completed 99.77%, Led 0.36% of laps he ran, 0 Wins, 0 Poles, 0 Top 3’s, 0 Top 5’s, 1 Top 10, 3 Top 15’s, 1 Finish out of Top 20, 0 DNF’s, 0 Stage Wins, 0.8 Stage Pts Per Stage
2023 Short track Grade: C
His lap in Top 15% was good at Short tracks, but that’s it. His finishes, Avg. Driver Rating, and stage stats are mediocre at best.
- 2023 Small track Stats (Avg. Fin. rank among drivers with 1+ Small Track start, 43 drivers)
- 4 Races, Avg. Finish 16.5(16th), 45.1% of Laps ran in Top15, Avg. Driver Rating 72.8(16th), Best 9th, Worst 26th, Laps Completed 100%, Led 0.00% of laps he ran, 0 Wins, 0 Poles, 0 Top 3’s, 0 Top 5’s, 1 Top 10, 2 Top 15’s, 1 Finish out of Top 20, 0 DNF’s, 0 Stage Wins, 0.5 Stage Pts Per Stage
2023 Small track Grade: C-
His Small track stats are similar to his Short track stats, except his Laps in Top 15% was bad at Small tracks. So, he gets a little lower grade in a C-.
- 2023 Intermediate Stats (Avg. Fin. rank among drivers with 1+ Intermediate Track start, 46 drivers)
- 8 Races, Avg. Finish 17.63(19th), 52.26% of Laps ran in Top15, Avg. Driver Rating 75.23(15th), Best 3rd, Worst 35th, Laps Completed 93.02%, Led 0.54% of laps he ran, 0 Wins, 0 Poles, 1 Top 3, 1 Top 5, 2 Top 10’s, 4 Top 15’s, 2 Finishes out of Top 20, 2 DNF’s, 0 Stage Wins, 0.76 Stage Pts Per Stage
2023 Intermediate Grade: D+
Getting only 2 Top 10’s in 8 Intermediate races for Rick Hendrick is not good, pair this with running just 52% of the laps in the Top 15 and you get a D+.
- 2023 Big track Stats (Avg. Fin. rank among drivers with 1+ Big Track start, 40 drivers)
- 3 Races, Avg. Finish 21.67(T24th), 77.33% of Laps ran in Top15, Avg. Driver Rating 80.93(12th), Best 8th, Worst 33rd, Laps Completed 88.21%, Led 7.29% of laps he ran, 0 Wins, 0 Poles, 0 Top 3’s, 0 Top 5’s, 1 Top 10, 1 Top 15, 2 Finishes out of Top 20, 1 DNF, 0 Stage Wins, 4.33 Stage Pts Per Stage
2023 Big track Grade: B-
His in-race stats, especially stage stats, at Big tracks was really impressive and deserve close to an A. Unfortunately he couldn’t finish the races which then drops him to a B-.
- 2023 Road Course Stats (Avg. Fin. rank among drivers with 1+ Road Course start, 49 drivers)
- 6 Races, Avg. Finish 15.17(14th), 70.36% of Laps ran in Top15, Avg. Driver Rating 80.65(14th), Best 3rd, Worst 37th, Laps Completed 93.01%, Led 0.00% of laps he ran, 0 Wins, 0 Poles, 1 Top 3, 2 Top 5’s, 3 Top 10s, 4 Top 15’s, 2 Finishes out of Top 20, 1 DNF, 0 Stage Wins, 1.25 Stage Pts Per Stage
2023 Road Course Grade: B-
He performed admirably on Road Courses this year running pretty well in races and getting 2 Top 5’s and a Top 10 in half the races.
- 2023 Superspeedway Stats (Avg. Fin. rank among drivers with 1+ Superspeedway start, 47 drivers)
- 6 Races, Avg. Finish 15.33(14th), 52.82% of Laps ran in Top15, Avg. Driver Rating 74.6(16th), Best 5th, Worst 28th, Laps Completed 100%, Led 2.74% of laps he ran, 0 Wins, 1 Pole, 0 Top 3’s, 1 Top 5, 2 Top 10’s, 4 Top 15’s, 2 Finishes out of Top 20, 0 DNF’s, 0 Stage Wins, 3.25 Stage Pts Per Stage
2023 Superspeedway Grade: B-
His stats at Superspeedways weren’t that bad this year with 2 Top 10’s and 3.25 Stage Pts Per Stage. However, running 53% of his laps in the Top 15 give him a B-.
- 2023 Dirt track Stats (Avg. Fin. rank among drivers with 1+ Dirt Track start, 37 drivers)
- 1 Races, Avg. Finish 29.0(29th), 85.08% of Laps ran in Top15, Avg. Driver Rating 75.7(16th), Best 29th, Worst 29th, Laps Completed 99.2%, Led 0.00% of laps he ran, 0 Wins, 0 Poles, 0 Top 3’s, 0 Top 5’s, 0 Top 10’s, 0 Top 15’s, 1 Finish out of Top 20, 0 DNF’s, 0 Stage Wins, 0.00 Stage Pts Per Stage
2023 Dirt track Grade: C
He ran well in the one Dirt race this year, but ultimately ended up 29th. So, good race plus bad finish equals average, C.
– The 48 car was the only Hendrick car to miss the Owner playoffs, finishing 20th and Bowman 20th as well.
– Every 2023 Rank above for Bowman is between 9th and T22nd
– In the playoffs he did not run or finish well for the most part
– He had a streak of 4 straight Top 10 finishes this year
– He ran a good amount of his 2023 Short track laps in the Top 15, but that was the only good thing about him at Short tracks
– His Top 15% at Small tracks was bad, but the rest of the stats were decent
– At Intermediates Bowman ran bad for being in a Hendrick car
– He had really good runs at Big tracks but couldn’t finish well
– Road Courses were probably his best overall track as he ran decent and finished admirably
– He barely ran half his laps at Superspeedways in the Top 15, but he finished there in 75% of his races
– In the Dirt he ran very well, but again he couldn’t finish the deal