
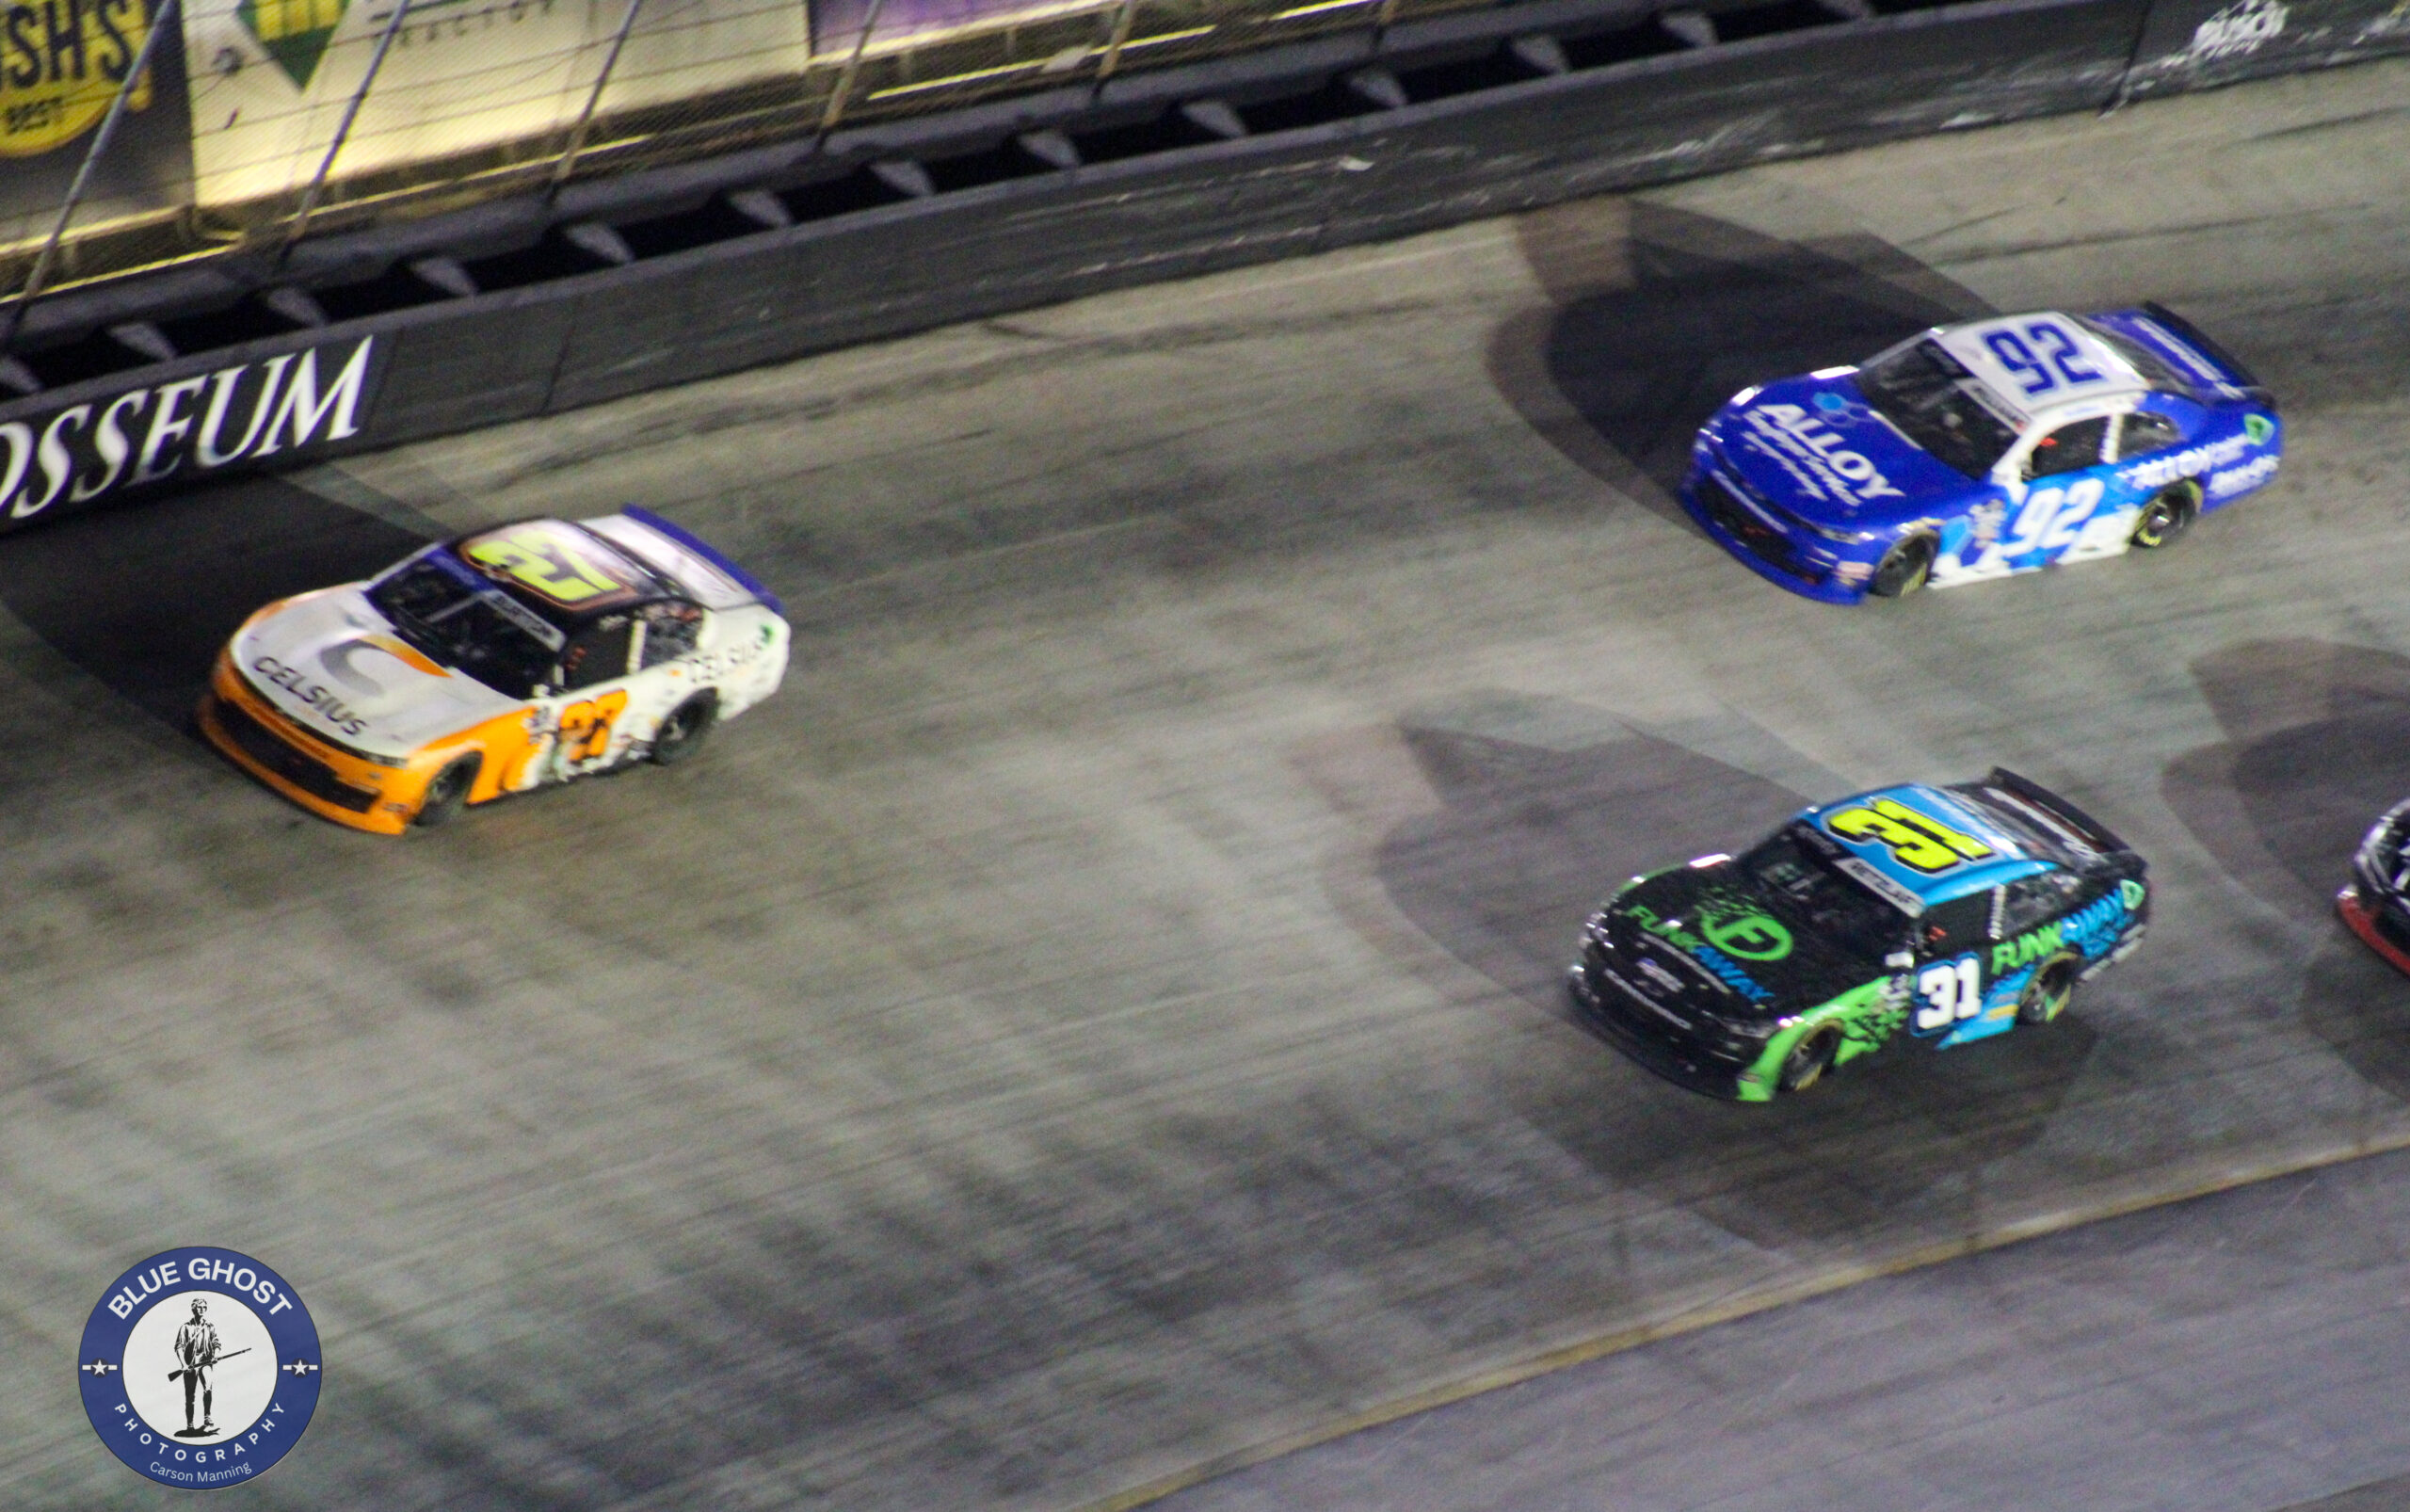
Jeb Burton – 12th in Driver points/12th in Owner points
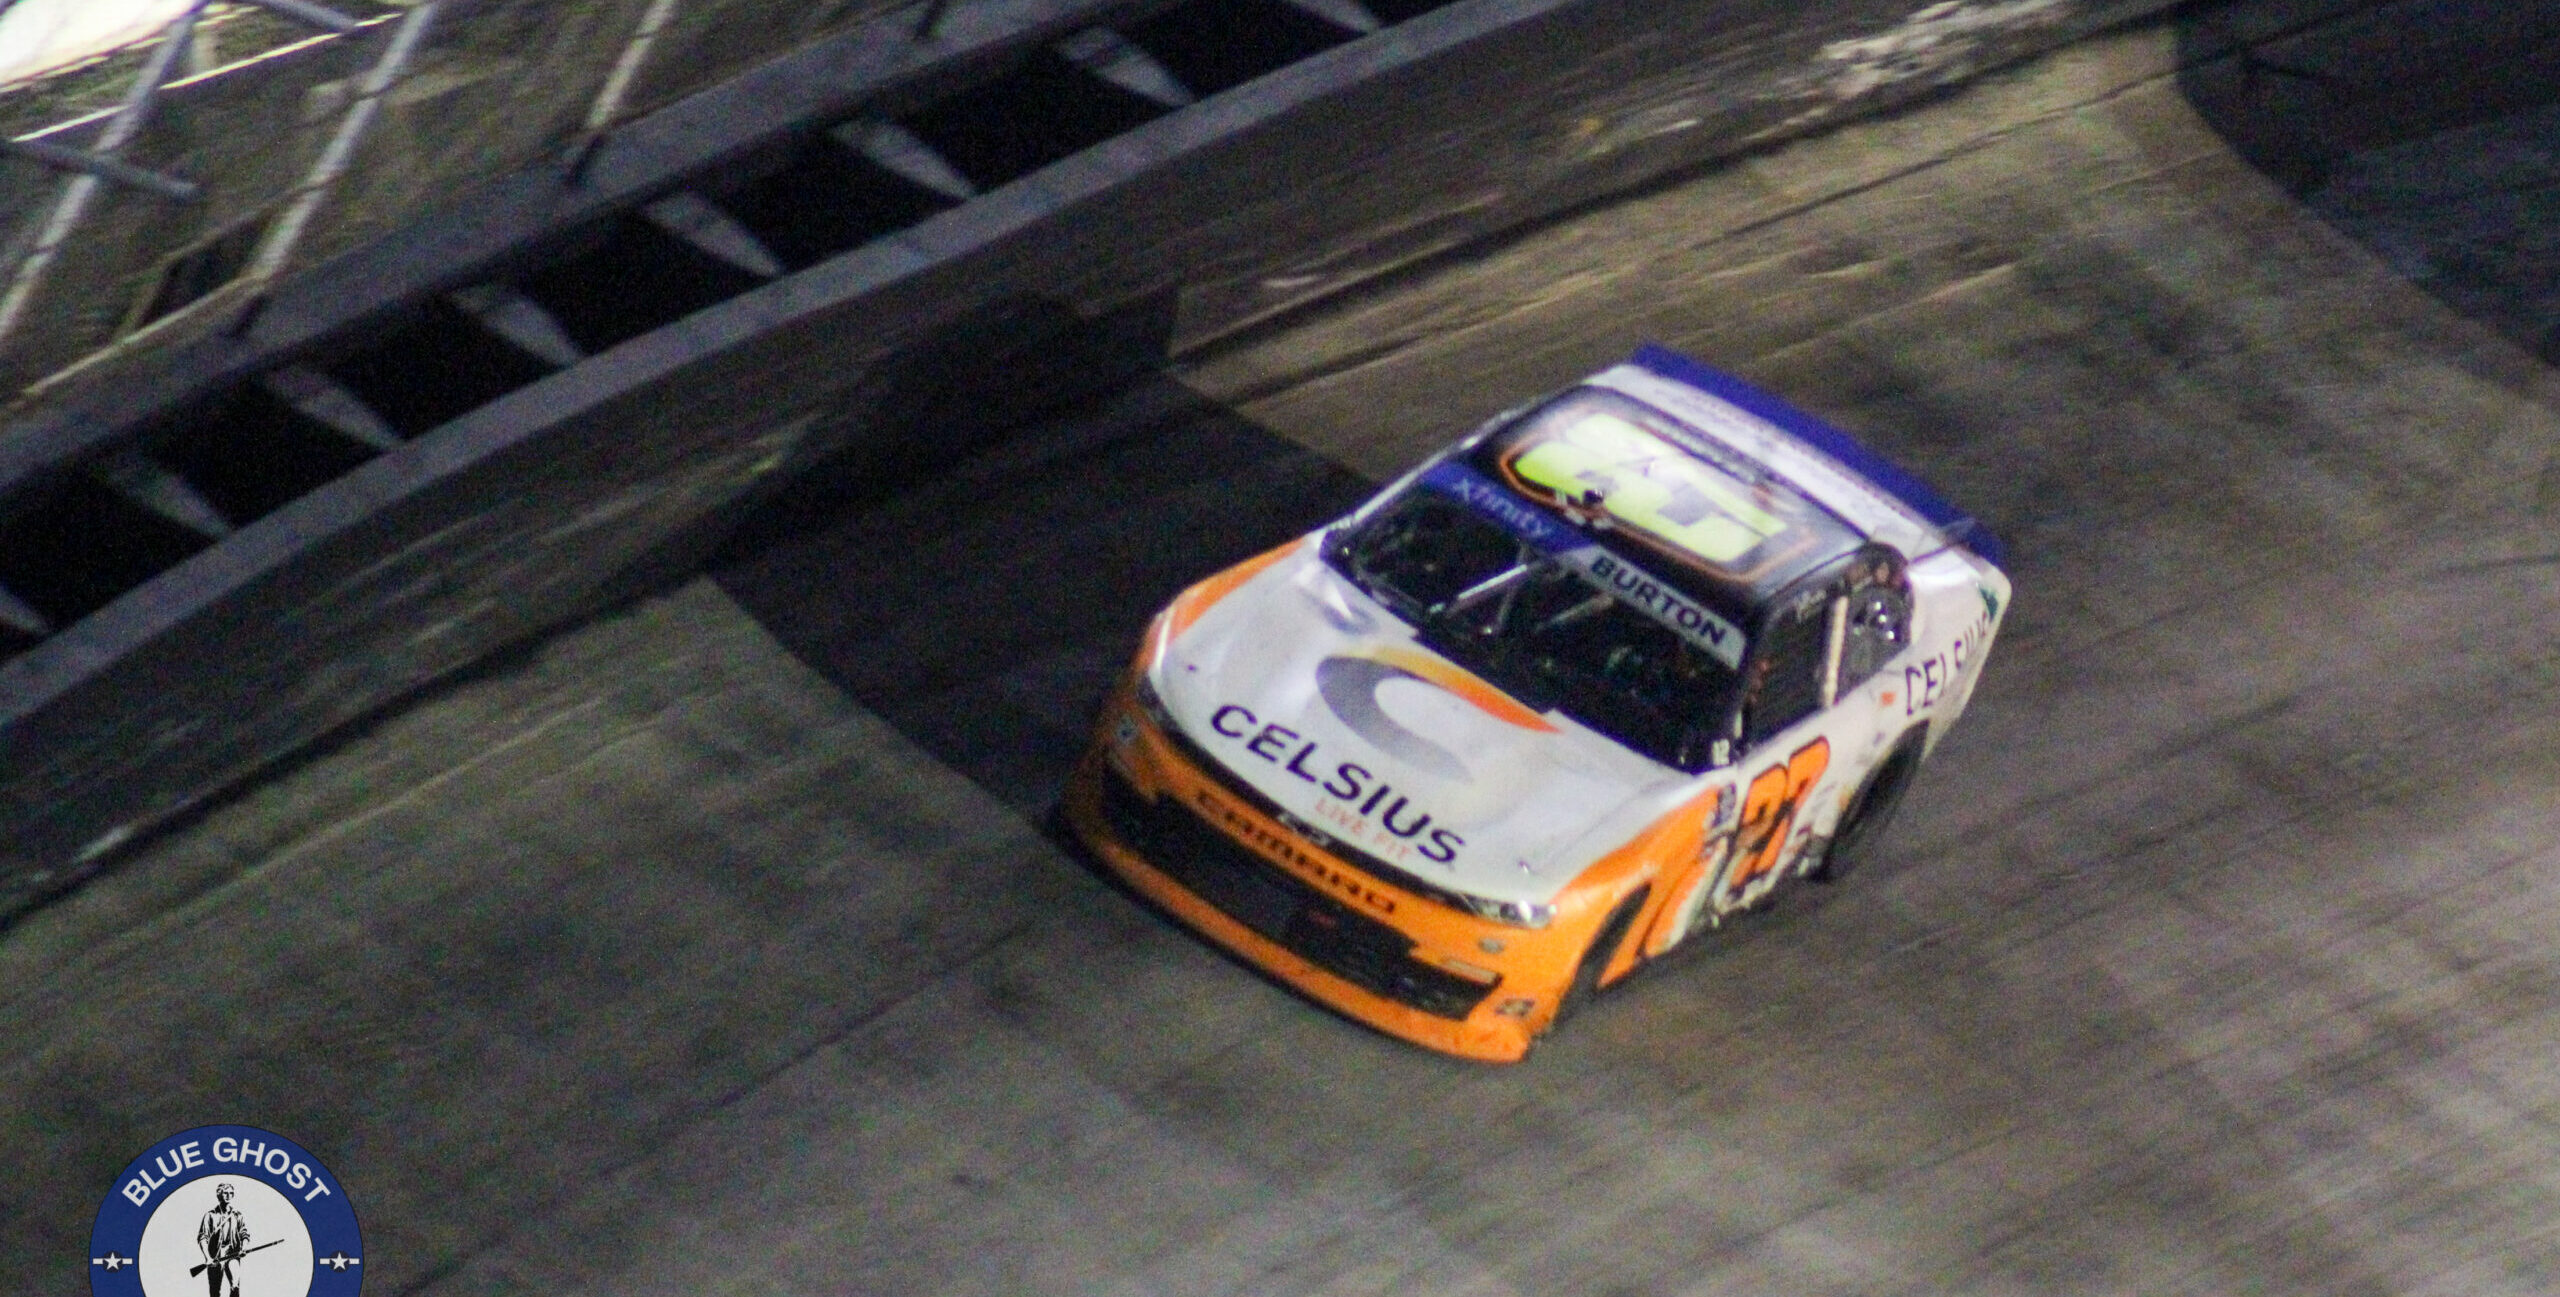
Jeb Burton won JAR their first race this year and made the playoffs to finish 12th in points. Image credit: Carson Manning
| Category | Statistic | 2023 Rank | ªRank Thru 33 Races |
| Avg. Fin.¹ | 15.64 | 13th of 31 | 92nd of 269 |
| Completed Laps%¹ | 98.0% | 2nd of 31 | 33rd of 269 |
| Laps in Top15%¹ | 39.65% | 15th of 31 | 125th of 269 |
| Avg. Driver Rating¹ | 70.16 | 15th of 31 | 130th of 269‡ |
| Wins | 1 | T7th of 105 | T54th of 858 |
| Poles | 0 | T13th of 105 | T91st of 858 |
| Top 2’s | 1 | T15th of 105 | T91st of 858 |
| Top 3’s | 1 | T18th of 105 | T125th of 858 |
| Top 5’s | 1 | T19th of 105 | T164th of 858 |
| Top 10’s | 6 | T17th of 105 | T128th of 858 |
| DNF’s¹ | 1 | 1st of 31 | T11th of 269 |
| Stage Wins | 1 | T14th of 105 | T82nd of 733* |
| Stage T10s | 7 | T18th of 105 | T143rd of 733* |
| Stage Pts | 28 | T18th of 105 | T115th of 733* |
| Playoff Pts² | 6 | 10th of 105 | T50th of 733* |
ªSince Playoffs started in 2016
¹Ranks of drivers to start 45% of races thru 33 races
²Earned from races only, does not reflect penalties
*Stage racing started in 2017
‡Max Driver Rating is 150.0
2023 stats Grade: B-
He had a win this year, which is good. However, that’s about the only really good thing he has going for him in the stats. His stage stats are especially bad so he gets a B-.
- 2023 Playoff Statistics (Avg. Fin. and Driver Rating rank among drivers with 3+ Playoff starts, 40 drivers)
- 7 Races, Avg. Finish 20.14(20th), 32.33% of Laps ran in Top15, Avg. Driver Rating 64.1(20th), Best 9th, Worst 34th, Laps Completed 93.13%, Led 0.08% of laps he ran, 0 Wins, 0 Poles, 0 Top 3’s, 0 Top 5’s, 1 Top 10, 3 Finishes out of Top 20, 1 DNF, 0 Stage Wins, 1 Stage T10, 0.14 Stage Pts Per Stage, 0 Playoff Pts earned in races
2023 Playoff Grade: C-
Once again his stage stats really weren’t good, neither was his Laps in Top 15%. However, he got 1 Top 10 and finished over half his races in the Top 20 so he gets a C-.
- Notable Streaks this year
- none (best was 1 straight)
2023 Streaks Grade: D-
Normally no streaks over 1 is an F, but he did have 6 one race Top 10 “streaks” so that’s not F worthy.
- 2023 Short track Stats (Avg. Fin. rank among drivers with 1+ Short Track start, 56 drivers)
- 4 Races, Avg. Finish 12.0(T10th), 41.1% of Laps ran in Top15, Avg. Driver Rating 68.4(22nd), Best 9th, Worst 14th, Laps Completed 100%, Led 0.00% of laps he ran, 0 Wins, 0 Poles, 0 Top 3’s, 0 Top 5’s, 1 Top 10, 4 Top 15’s, 0 Finishes out of Top 20, 0 DNF’s, 0 Stage Wins, 0.00 Stage Pts Per Stage
2023 Short track Grade: C+
He was one of just 2 drivers to get a Top 15 in every Short track race, but he got 0 Stage Pts, ran just 41% of his laps in the Top 15, and had just 1 Top 10. So C+ is fitting.
- 2023 Small track Stats (Avg. Fin. rank among drivers with 1+ Small Track start, 53 drivers)
- 4 Races, Avg. Finish 14.75(18th), 49.01% of Laps ran in Top15, Avg. Driver Rating 74.1(18th), Best 7th, Worst 22nd, Laps Completed 99.75%, Led 0.00% of laps he ran, 0 Wins, 0 Poles, 0 Top 3’s, 0 Top 5’s, 1 Top 10, 2 Top 15’s, 1 Finish out of Top 20, 0 DNF’s, 0 Stage Wins, 0.00 Stage Pts Per Stage
2023 Small track Grade: C
His stats are just slightly worse than his Short track stats overall with just 2 Top 15’s so he gets a sightly worse grade with a C.
- 2023 Intermediate Stats (Avg. Fin. rank among drivers with 1+ Intermediate Track start, 74 drivers)
- 9 Races, Avg. Finish 16.56(24th), 38.79% of Laps ran in Top15, Avg. Driver Rating 68.16(32nd), Best 7th, Worst 31st, Laps Completed 94.15%, Led 0.00% of laps he ran, 0 Wins, 0 Poles, 0 Top 3’s, 0 Top 5’s, 1 Top 10, 5 Top 15’s, 2 Finishes out of Top 20, 1 DNF, 0 Stage Wins, 0.00 Stage Pts Per Stage
2023 Intermediate Grade: C
He had just 1 Top 10, but most of his finishes were in the Top 15. However, he got 0 Stage Pts, but what saved him from a C- was that he had just 2 finishes out of the Top 20.
- 2023 Big track Stats (Avg. Fin. rank among drivers with 1+ Big Track start, 53 drivers)
- 3 Races, Avg. Finish 14.67(T16th), 30.25% of Laps ran in Top15, Avg. Driver Rating 67.33(23rd), Best 10th, Worst 22nd, Laps Completed 100%, Led 0.00% of laps he ran, 0 Wins, 0 Poles, 0 Top 3’s, 0 Top 5’s, 1 Top 10, 2 Top 15’s, 1 Finish out of Top 20, 0 DNF’s, 0 Stage Wins, 0.00 Stage Pts Per Stage
2023 Big track Grade: C-
What hurt his grade yet again was no Stage Pts and his poor Laps in Top 15%. What helped him avoid a D was his 1 Top 10, 2 Top 15’s, and decent Avg. Driver Rating.
- 2023 Road Course Stats (Avg. Fin. rank among drivers with 1+ Road Course start, 66 drivers)
- 8 Races, Avg. Finish 20.38(27th), 38.57% of Laps ran in Top15, Avg. Driver Rating 65.5(29th), Best 10th, Worst 34th, Laps Completed 99.8%, Led 0.2% of laps he ran, 0 Wins, 0 Poles, 0 Top 3’s, 0 Top 5’s, 1 Top 10, 2 Top 15’s, 4 Finishes out of Top 20, 0 DNF’s, 0 Stage Wins, 0.25 Stage Pts Per Stage
2023 Road Course Grade: D+
He actually had Stage Pts at Road Courses, but he had just 2 Top 15’s in 8 races. That’s not that good. So, his finishes are what really hurt him and got him a D+.
- 2023 Superspeedway Stats (Avg. Fin. rank among drivers with 1+ Superspeedway start, 59 drivers)
- 5 Races, Avg. Finish 10.6(7th), 40.12% of Laps ran in Top15, Avg. Driver Rating 81.16(16th), Best 1st, Worst 16th, Laps Completed 100%, Led 2.47% of laps he ran, 1 Win, 0 Poles, 1 Top 3, 1 Top 5, 1 Top 10, 4 Top 15’s, 0 Finishes out of Top 20, 0 DNF’s, 1 Stage Win, 2.4 Stage Pts Per Stage
2023 Superspeedway Grade: B+
He was able to win which is great for this team! However, that was his only Top 10 and he ran only 40% of his laps in the Top 10, but he did get 4 Top 10’s and 2.4 Stage Pts Per Stage.
– A win at Talladega early in the year put Burton in the playoffs, finishing 12th in points
– The win was Burton’s lone bright spot, but he had a few other good finishes
– He didn’t run that good in the playoffs, but he did have most of his finishes in the Top 15
– He didn’t get any streaks longer than a 1 race Top 10 “streak”
– Short tracks were a good track for him as he finished all 4 races in the Top 15, but he didn’t have the best runs
– His runs were better on Small tracks than Short tracks, but his finishes weren’t as good
– Burton got 5 Intermediate Top 10’s, but just 1 Top 10 and ran under 40% of his laps in the Top 15
– He was able to pull out 2 Top 15’s in 3 Big track races, but otherwise he ran poorly
– His worst tracks were Road Courses where he didn’t run awful, but he didn’t do good either
– Superspeedway’s were his best tracks, but his win was his only Top 10 and he didn’t run many laps in the Top 15
Parker Retzlaff – 16th in Driver points/18th in Owner points
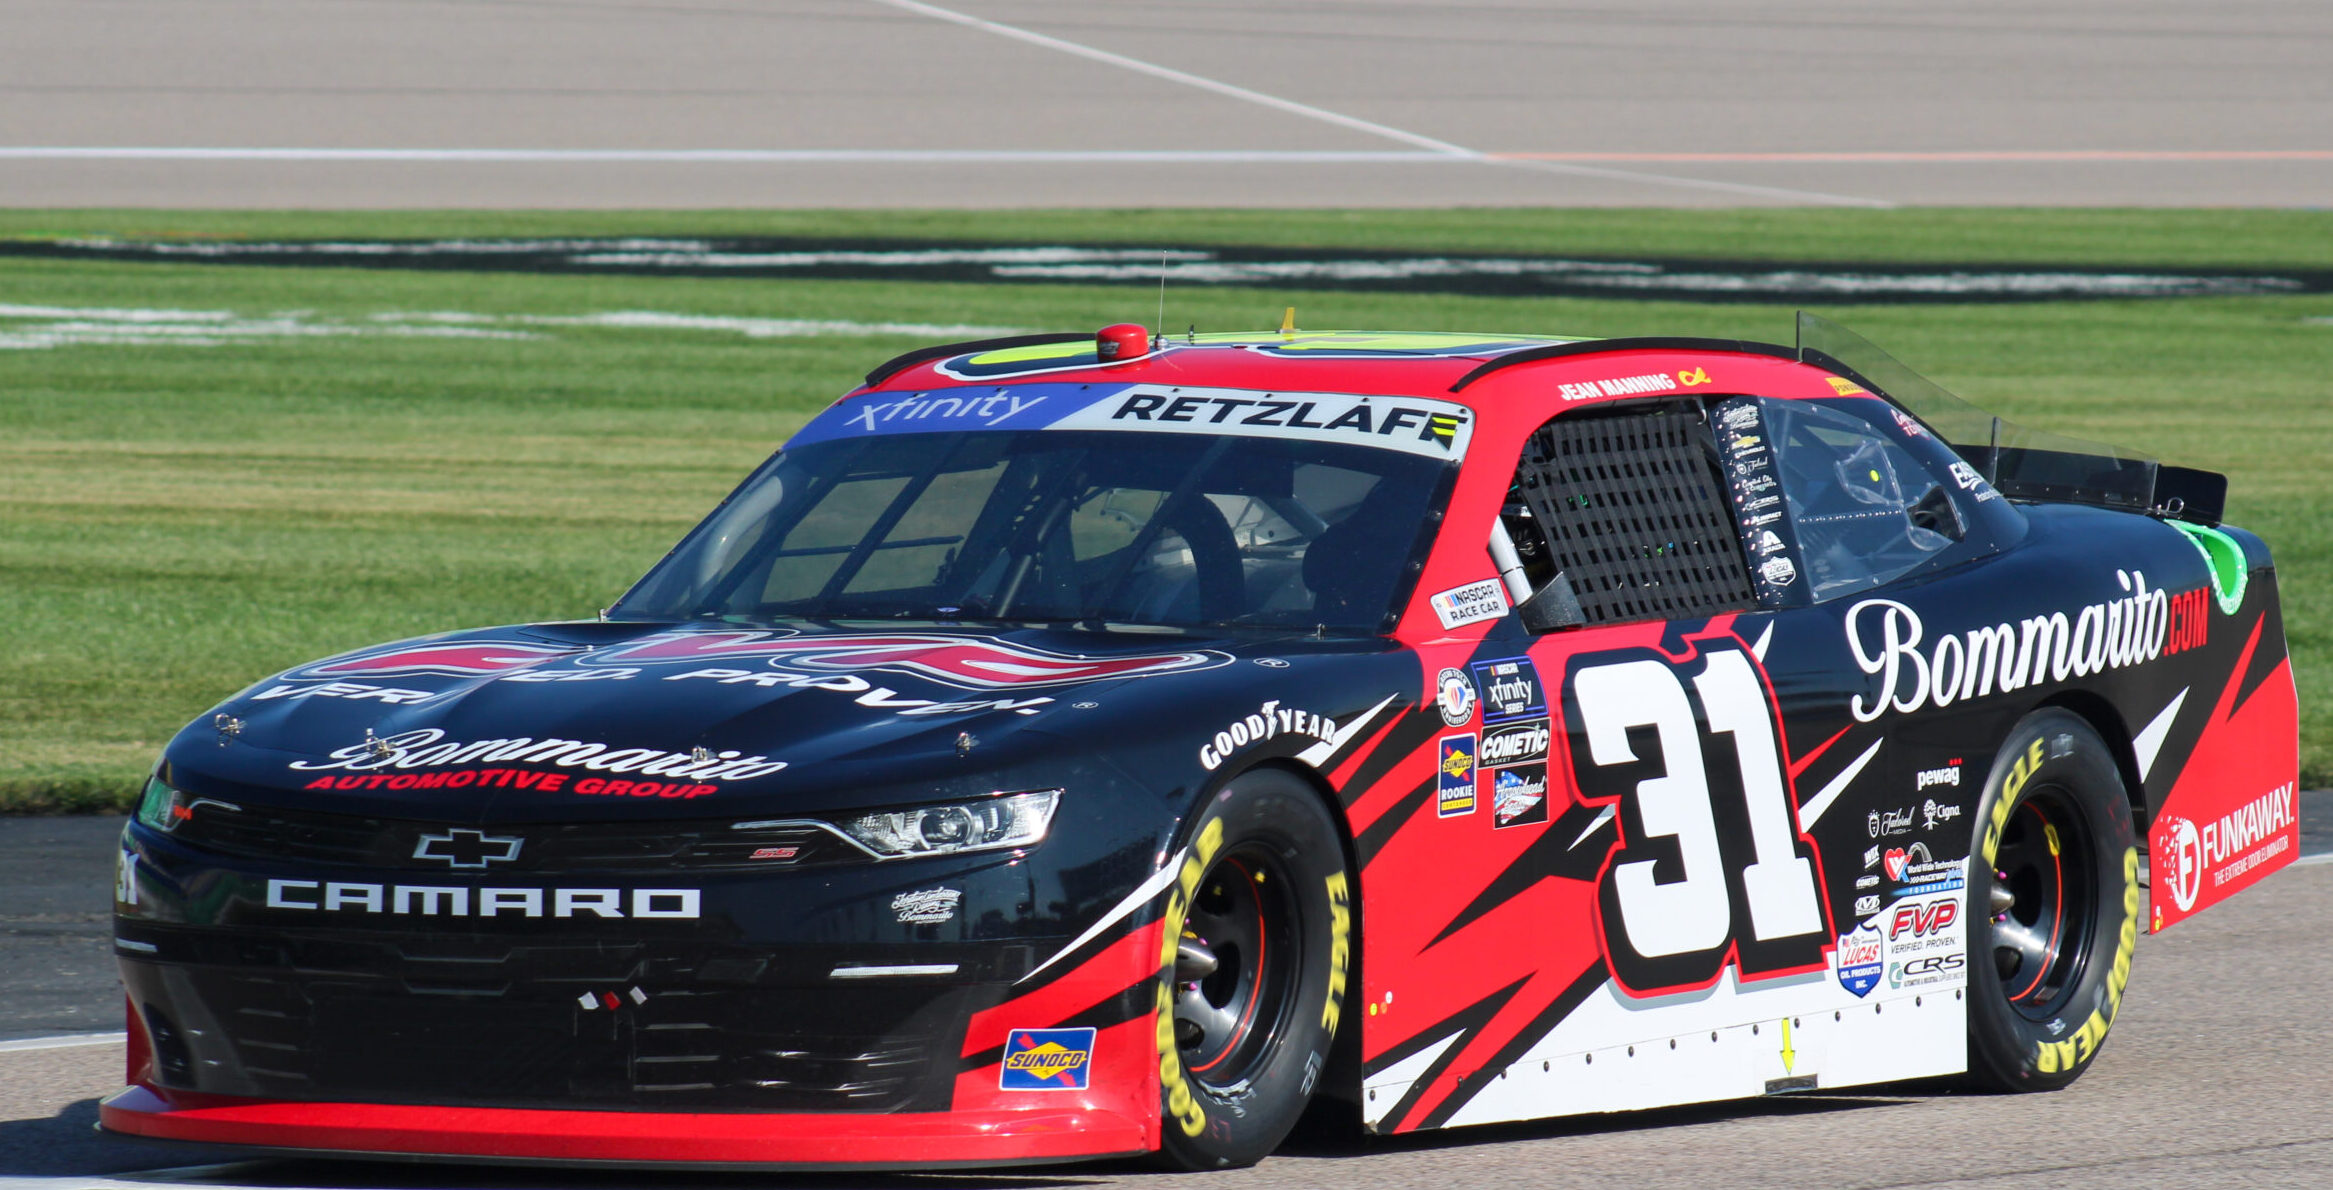
Parker Retzlaff had a decent first year at Jordan Anderson Racing, finishing 16th in points. Image credit: Carson Manning (his mother’s name above the door to remember her during the Kansas weekend)
| Category | Statistic | 2023 Rank | ªRank Thru 33 Races |
| Avg. Fin.¹ | 17.88 | T15th of 31 | T119th of 269 |
| Completed Laps%¹ | 96.0% | 9th of 31 | 76th of 269 |
| Laps in Top15%¹ | 38.85% | 18th of 31 | 130th of 269 |
| Avg. Driver Rating¹ | 67.69 | 18th of 31 | 134th of 269‡ |
| Wins | 0 | T16th of 105 | T109th of 858 |
| Poles | 0 | T17th of 105 | T91st of 858 |
| Top 2’s | 0 | T22nd of 105 | T167th of 858 |
| Top 3’s | 0 | T23rd of 105 | T193rd of 858 |
| Top 5’s | 1 | T19th of 105 | T164th of 858 |
| Top 10’s | 7 | 16th of 105 | T119th of 858 |
| DNF’s¹ | 4 | T10th of 31 | T90th of 269 |
| Stage Wins | 0 | T17th of 105 | T128th of 733* |
| Stage T10s | 8 | 17th of 105 | T130th of 733* |
| Stage Pts | 28 | T15th of 105 | T115th of 733* |
| Playoff Pts² | 0 | T15th of 105 | T98th of 733* |
ªSince Playoffs started in 2016
¹Ranks of drivers to start 45% of races thru 33 races
²Earned from races only, does not reflect penalties
*Stage racing started in 2017
‡Max Driver Rating is 150.0
2023 stats Grade: C
For a rookie with a tier 2 team his stats aren’t bad, but they are also not good. This is especially the case for his stages, so he gets a C.
- 2023 Playoff Statistics (Avg. Fin. and Driver Rating rank among drivers with 3+ Playoff starts, 40 drivers)
- 7 Races, Avg. Finish 16.14(T14th), 54.14% of Laps ran in Top15, Avg. Driver Rating 72.27(17th), Best 7th, Worst 30th, Laps Completed 93.41%, Led 0.00% of laps he ran, 0 Wins, 0 Poles, 0 Top 3’s, 0 Top 5’s, 1 Top 10, 2 Finishes out of Top 20, 1 DNF, 0 Stage Wins, 1 Stage T10, 0.36 Stage Pts Per Stage, 0 Playoff Pts earned in races
2023 Playoff Grade: C+
His Avg. Finish is really not too bad, neither is his Avg. Driver Rating, and he ran over half his laps in the Top 15. However, he had only 1 Top 10 and 1 Stage T10 so he gets a C+.
- Notable Streaks this year
- none (best was 1 straight)
2023 Streaks Grade: D-
He, like his teammate above, had no streaks over 1, but he had 7 one race Top 10 “streaks” so I gave him the same grade.
- 2023 Short track Stats (Avg. Fin. rank among drivers with 1+ Short Track start, 56 drivers)
- 4 Races, Avg. Finish 12.25(13th), 58.01% of Laps ran in Top15, Avg. Driver Rating 75.68(21st), Best 7th, Worst 16th, Laps Completed 99.91%, Led 0.00% of laps he ran, 0 Wins, 0 Poles, 0 Top 3’s, 0 Top 5’s, 1 Top 10, 3 Top 15’s, 0 Finishes out of Top 20, 0 DNF’s, 0 Stage Wins, 0.88 Stage Pts Per Stage
2023 Short track Grade: B-
I compared him to Kaz Grala who was in his first full year in a tier 2 team as well. Retzlaff has a better Avg. Finish and Laps in Top 15%, but a worse Avg. Driver Rating and Top 5/10’s so they get the same grade.
- 2023 Small track Stats (Avg. Fin. rank among drivers with 1+ Small Track start, 53 drivers)
- 4 Races, Avg. Finish 19.75(24th), 27.43% of Laps ran in Top15, Avg. Driver Rating 66.4(21st), Best 13th, Worst 31st, Laps Completed 97.9%, Led 0.25% of laps he ran, 0 Wins, 0 Poles, 0 Top 3’s, 0 Top 5’s, 0 Top 10’s, 1 Top 15, 1 Finish out of Top 20, 1 DNF, 0 Stage Wins, 1.13 Stage Pts Per Stage
2023 Small track Grade: D+
His Laps in Top 15% is pretty bad, but his Avg. Finish and Avg. Driver Rating aren’t too bad. In addition he got 1 Top 15 and 1.13 Stage Pts Per Stage so I gave him a D+.
- 2023 Intermediate Stats (Avg. Fin. rank among drivers with 1+ Intermediate Track start, 74 drivers)
- 9 Races, Avg. Finish 17.44(28th), 49.91% of Laps ran in Top15, Avg. Driver Rating 71.43(29th), Best 6th, Worst 37th, Laps Completed 93.68%, Led 0.5% of laps he ran, 0 Wins, 0 Poles, 0 Top 3’s, 0 Top 5’s, 2 Top 10’s, 6 Top 15’s, 3 Finishes out of Top 20, 1 DNF, 0 Stage Wins, 0.39 Stage Pts Per Stage
2023 Intermediate Grade: C+
His in-race stats aren’t all that bad as he ran almost half his laps in the Top 15 and led laps. In addition he had 6 Top 15’s, but what kept him from a B- was his just 2 Top 10’s.
- 2023 Big track Stats (Avg. Fin. rank among drivers with 1+ Big Track start, 53 drivers)
- 3 Races, Avg. Finish 21.33(28th), 14.21% of Laps ran in Top15, Avg. Driver Rating 61.77(26th), Best 9th, Worst 35th, Laps Completed 97.82%, Led 0.00% of laps he ran, 0 Wins, 0 Poles, 0 Top 3’s, 0 Top 5’s, 1 Top 10, 1 Top 15, 1 Finish out of Top 20, 0 DNF’s, 0 Stage Wins, 0.00 Stage Pts Per Stage
2023 Big track Grade: D
He had 1 Top 10, but he also ran only 14% of his laps in the Top 15. Top this off with 0 Stage Pts and a below average Avg. Driver Rating and you get a D.
- 2023 Road Course Stats (Avg. Fin. rank among drivers with 1+ Road Course start, 66 drivers)
- 8 Races, Avg. Finish 22.5(36th), 8.86% of Laps ran in Top15, Avg. Driver Rating 58.41(33rd), Best 14th, Worst 38th, Laps Completed 87.37%, Led 0.00% of laps he ran, 0 Wins, 0 Poles, 0 Top 3’s, 0 Top 5’s, 0 Top 10’s, 1 Top 15, 4 Finishes out of Top 20, 1 DNF, 0 Stage Wins, 0.25 Stage Pts Per Stage
2023 Road Course Grade: D-
The reasons for the low grade are simple. Even for a rookie on a tier 2 team his Laps in Top 15% is terrible, his Avg. Driver Rating is not good, and his Avg. Driver Rating is even worse.
- 2023 Superspeedway Stats (Avg. Fin. rank among drivers with 1+ Superspeedway start, 59 drivers)
- 5 Races, Avg. Finish 12.2(9th), 40.21% of Laps ran in Top15, Avg. Driver Rating 73.98(22nd), Best 4th, Worst 27th, Laps Completed 98.69%, Led 0.29% of laps he ran, 0 Wins, 0 Poles, 0 Top 3’s, 1 Top 5, 3 Top 10’s, 3 Top 15’s, 1 Finish out of Top 20, 1 DNF, 0 Stage Wins, 0.1 Stage Pts Per Stage
2023 Superspeedway Grade: B-
What kept him from a better grade is that he had very few Stage Pts and ran a not good percentage of his laps in the Top 15. However, he got 3 Top 10’s and the 9th best Avg. Finish so he gets a B-.
– Retzlaff didn’t do too bad in his first season at JAR, finishing 16th in points
– Retzlaff’s runs weren’t the best, including his stages, but he did get a decent amount of Top 10’s
– He ran better overall in the playoffs, but his stages were still bad
– Even with 7 Top 10’s he didn’t have back-to-back Top 10’s once
– Short tracks were some of his better tracks as he finished Top 16 in every race
– Small tracks weren’t as good for him as he ran very poor and had mediocre finishes
– In 9 Intermediate races Retzlaff was able to get 6 Top 15’s and run pretty decent
– His runs at Big tracks were pretty bad, but he pulled out 1 Top 15 and 2 Top 20’s
– Road Courses were his worst tracks as he didn’t run or finish good on them
– He got 3 Top 10’s in 5 Superspeedway races, but he didn’t spend much time in the Top 15
Josh Williams – 21st in Driver points/23rd in Owner points
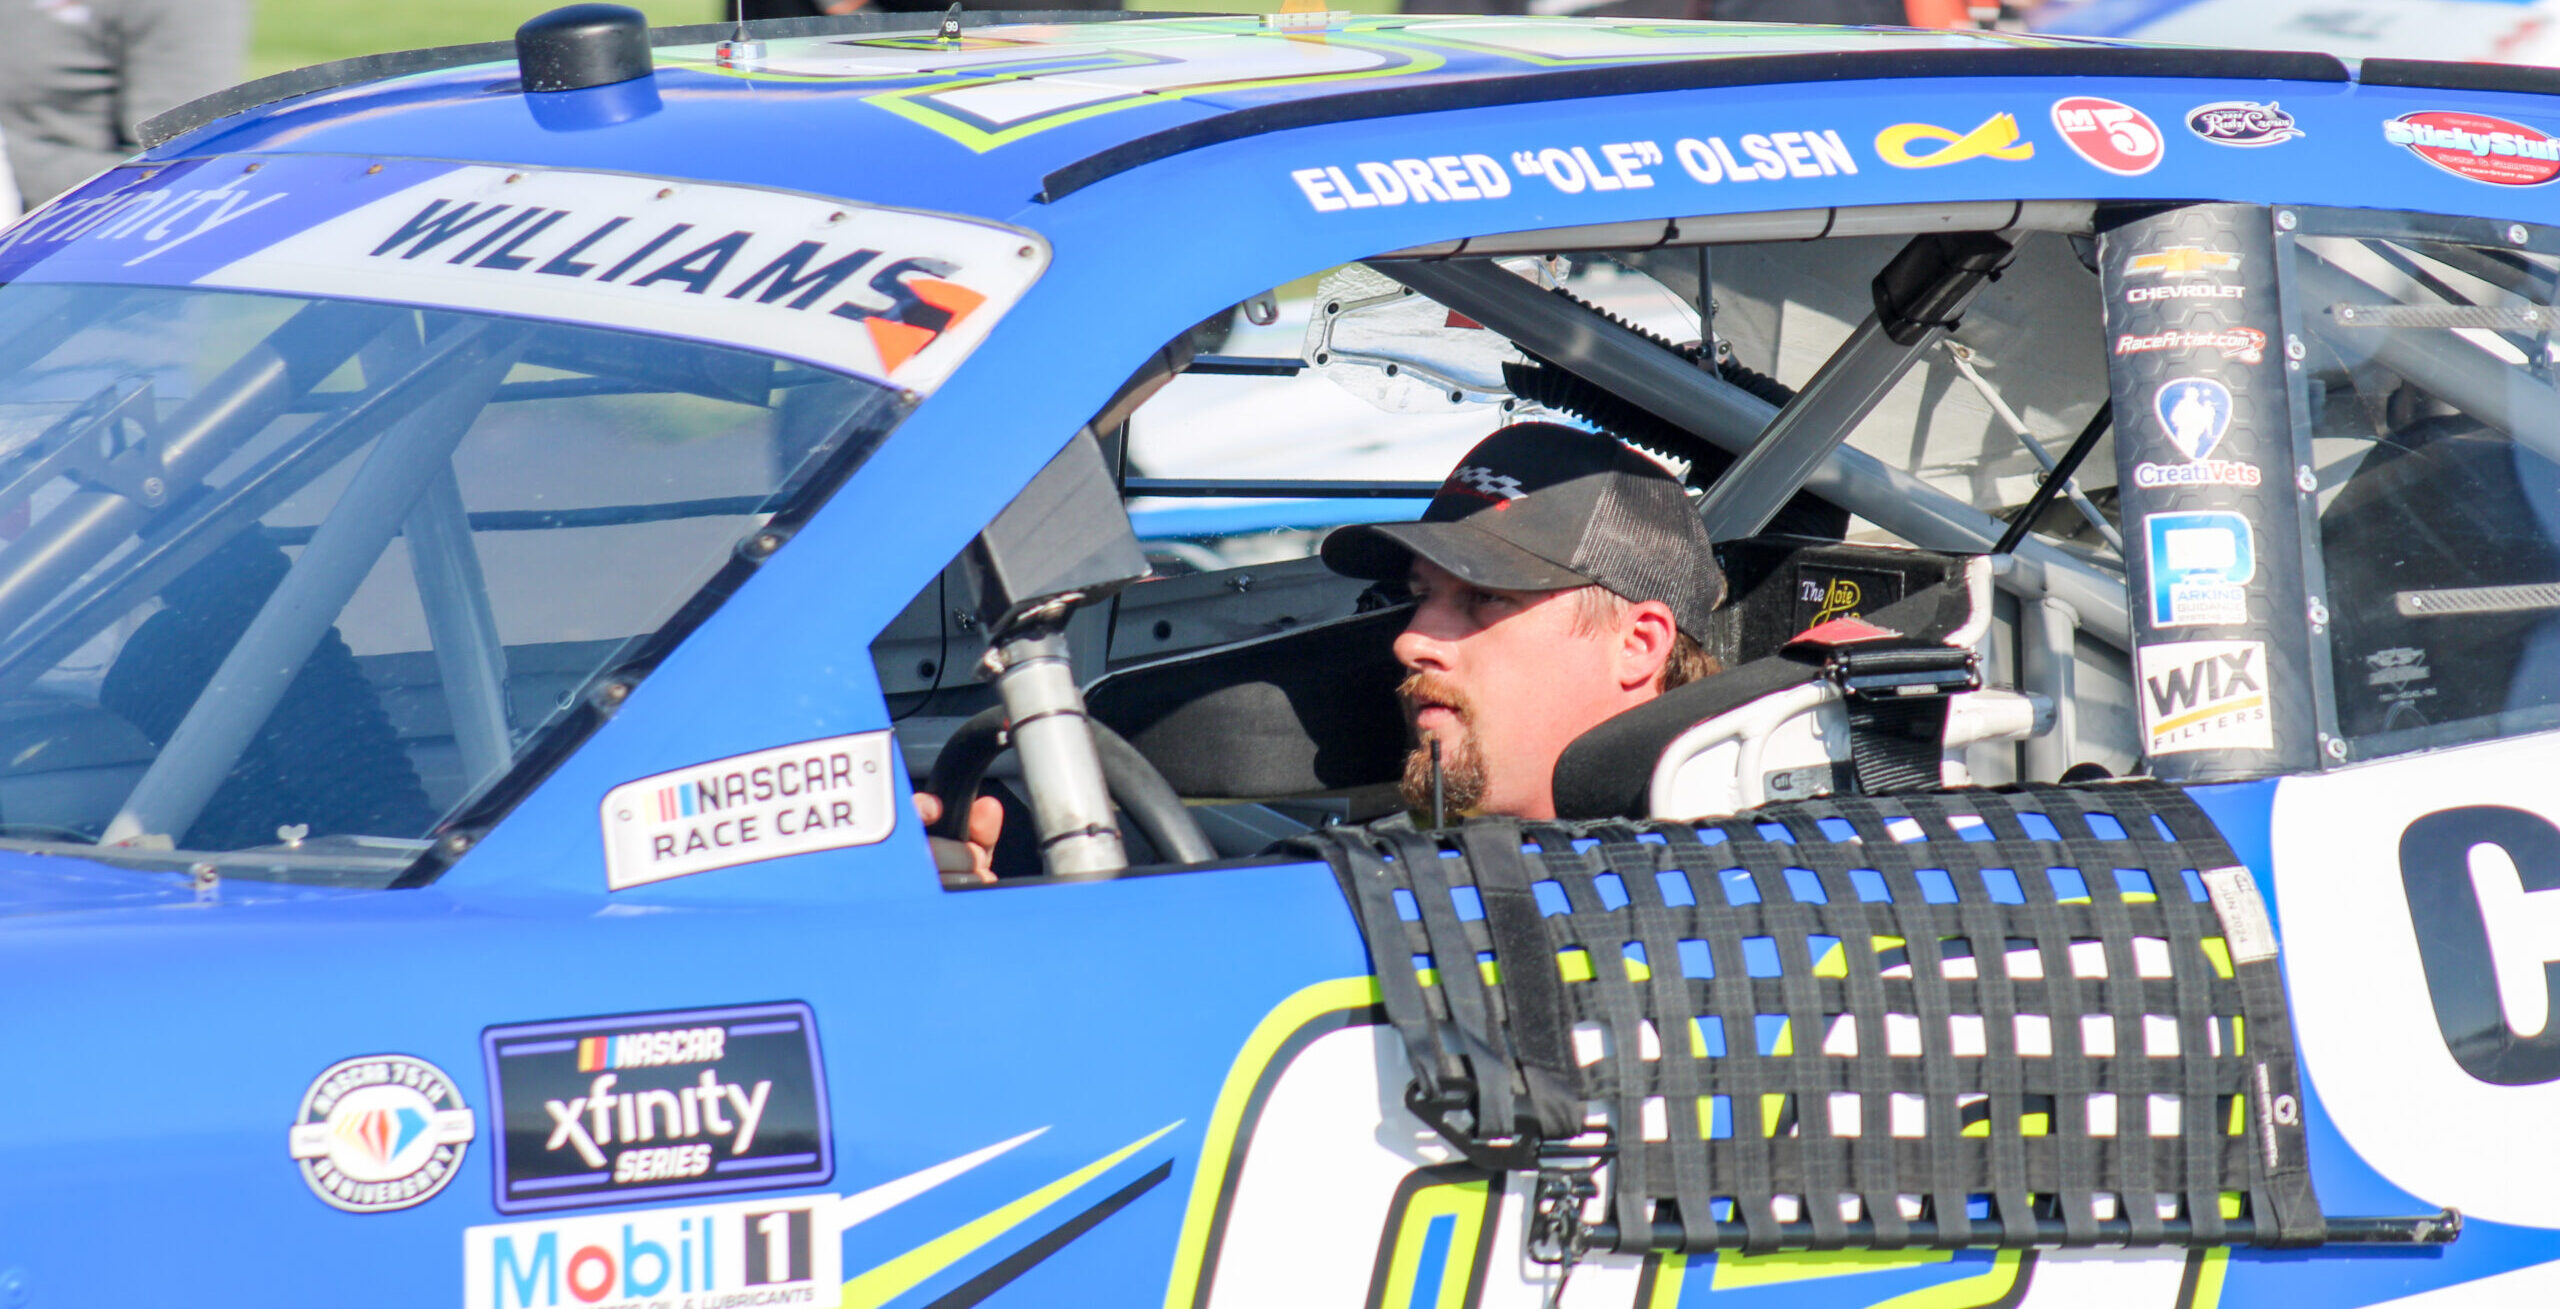
Josh Williams ran 32 of the 33 races due to a suspension from when he became a folk hero parking his car on the front stretch at Atlanta. Image credit: Carson Manning
| Category | Statistic | 2023 Rank | ªRank Thru 33 Races |
| Avg. Fin.¹ | 23.28 | 20th of 31 | 174th of 269 |
| Completed Laps%¹ | 90.35% | 20th of 31 | 171st of 269 |
| Laps in Top15%¹ | 7.06% | 25th of 31 | 181st of 269 |
| Avg. Driver Rating¹ | 50.98 | 23rd of 31 | 190th of 269‡ |
| Wins | 0 | T16th of 105 | T109th of 858 |
| Poles | 0 | T13th of 105 | T91st of 858 |
| Top 2’s | 0 | T22nd of 105 | T167th of 858 |
| Top 3’s | 0 | T23rd of 105 | T193rd of 858 |
| Top 5’s | 0 | T34th of 105 | T267th of 858 |
| Top 10’s | 3 | T22nd of 105 | T179th of 858 |
| DNF’s¹ | 6 | T20th of 31 | T166th of 269 |
| Stage Wins | 0 | T17th of 105 | T128th of 733* |
| Stage T10s | 1 | T41st of 105 | T276th of 733* |
| Stage Pts | 6 | T28th of 105 | T192nd of 733* |
| Playoff Pts² | 0 | T15th of 105 | T98th of 733* |
ªSince Playoffs started in 2016
¹Ranks of drivers to start 45% of races thru 33 races
²Earned from races only, does not reflect penalties
*Stage racing started in 2017
‡Max Driver Rating is 150.0
2023 stats Grade: D
He’s in a tier 3 car and had 3 Top 10’s with a decent-ish Avg. Finish, but what hurt him were his very poor in-race stats. That’s why even with 3 Top 10’s he gets a D.
- 2023 Playoff Statistics (Avg. Fin. and Driver Rating rank among drivers with 3+ Playoff starts, 40 drivers)
- 7 Races, Avg. Finish 21.29(22nd), 3.09% of Laps ran in Top15, Avg. Driver Rating 50.86(30th), Best 14th, Worst 33rd, Laps Completed 89.48%, Led 0.00% of laps he ran, 0 Wins, 0 Poles, 0 Top 3’s, 0 Top 5’s, 0 Top 10’s, 2 Finishes out of Top 20, 1 DNF, 0 Stage Wins, 0 Stage T10’s, 0.00 Stage Pts Per Stage, 0 Playoff Pts earned in races
2023 Playoff Grade: D
What almost got him a D+ was the fact he didn’t finish many races out of the Top 20, but his in-race stats are just so bad that he gets another D.
- Notable Streaks this year
- 2 straight Top 10 finishes
2023 Streaks Grade: C+
He got 2 straight Top 10’s in a DGM car, that’s impressive. So he gets a C+.
- 2023 Short track Stats (Avg. Fin. rank among drivers with 1+ Short Track start, 56 drivers)
- 4 Races, Avg. Finish 21.5(27th), 3.33% of Laps ran in Top15, Avg. Driver Rating 52.43(32nd), Best 14th, Worst 33rd, Laps Completed 99.53%, Led 0.00% of laps he ran, 0 Wins, 0 Poles, 0 Top 3’s, 0 Top 5’s, 0 Top 10’s, 1 Top 15, 1 Finish out of Top 20, 0 DNF’s, 0 Stage Wins, 0.00 Stage Pts Per Stage
2023 Short track Grade: D-
His Laps in Top 15% is very, very bad. However, he got 1 Top 15 and only finished out of the Top 20 once, so he scrapes out a D-.
- 2023 Small track Stats (Avg. Fin. rank among drivers with 1+ Small Track start, 53 drivers)
- 4 Races, Avg. Finish 19.25(23rd), 12.9% of Laps ran in Top15, Avg. Driver Rating 58.75(27th), Best 8th, Worst 25th, Laps Completed 99.75%, Led 0.00% of laps he ran, 0 Wins, 0 Poles, 0 Top 3’s, 0 Top 5’s, 1 Top 10, 1 Top 15, 3 Finishes out of Top 20, 0 DNF’s, 0 Stage Wins, 0.75 Stage Pts Per Stage
2023 Small track Grade: D
His stats are better than his Short track stats, but what hurt him is that even with 1 Top 10 that was his only Top 20 finish. So, even with better stats it ends up being just slightly better.
- 2023 Intermediate Stats (Avg. Fin. rank among drivers with 1+ Intermediate Track start, 74 drivers)
- 9 Races, Avg. Finish 24.22(45th), 9.32% of Laps ran in Top15, Avg. Driver Rating 47.6(50th), Best 13th, Worst 37th, Laps Completed 85.64%, Led 0.00% of laps he ran, 0 Wins, 0 Poles, 0 Top 3’s, 0 Top 5’s, 0 Top 10’s, 1 Top 15, 4 Finishes out of Top 20, 2 DNF’s, 0 Stage Wins, 0.00 Stage Pts Per Stage
2023 Intermediate Grade: D-
If these stats were from a driver with a better team this would for sure be an F. However, with a tier 3 team getting 1 Top 15 and an Avg. Driver Rating less than 50 gets him a D-.
- 2023 Big track Stats (Avg. Fin. rank among drivers with 1+ Big Track start, 53 drivers)
- 3 Races, Avg. Finish 24.67(30th), 4.78% of Laps ran in Top15, Avg. Driver Rating 52.63(31st), Best 16th, Worst 36th, Laps Completed 97.0%, Led 0.00% of laps he ran, 0 Wins, 0 Poles, 0 Top 3’s, 0 Top 5’s, 0 Top 10’s, 0 Top 15’s, 2 Finishes out of Top 20, 0 DNF’s, 0 Stage Wins, 0.00 Stage Pts Per Stage
2023 Big track Grade: F+
His Laps in Top 15% was just very bad and his Avg. Driver Rating wasn’t too pretty either. Mix this with most finishes coming out of the Top 20 and you get an F+.
- 2023 Road Course Stats (Avg. Fin. rank among drivers with 1+ Road Course start, 66 drivers)
- 7 Races, Avg. Finish 28.14(53rd), 1.41% of Laps ran in Top15, Avg. Driver Rating 41.73(49th), Best 16th, Worst 36th, Laps Completed 79.78%, Led 0.00% of laps he ran, 0 Wins, 0 Poles, 0 Top 3’s, 0 Top 5’s, 0 Top 10’s, 0 Top 15’s, 5 Finishes out of Top 20, 2 DNF’s, 0 Stage Wins, 0.00 Stage Pts Per Stage
2023 Road Course Grade: F-
He ran so bad at Road Courses and his finishes reflected that way too much to give him anything but an F-.
- 2023 Superspeedway Stats (Avg. Fin. rank among drivers with 1+ Superspeedway start, 59 drivers)
- 5 Races, Avg. Finish 18.6(22nd), 11.07% of Laps ran in Top15, Avg. Driver Rating 61.62(29th), Best 9th, Worst 32nd, Laps Completed 80.09%, Led 0.00% of laps he ran, 0 Wins, 0 Poles, 0 Top 3’s, 0 Top 5’s, 2 Top 10’s, 3 Top 15’s, 2 Finishes out of Top 20, 2 DNF’s, 0 Stage Wins, 0.00 Stage Pts Per Stage
2023 Superspeedway Grade: C
He had 2 Top 10’s and 3 Top 15’s which is great for this small team, however he ran just 11% of his laps in the Top 15 which is poor poor. So it all equals out to be average, hence C.
– Before moving to Kaulig next year, Williams was able to finish 21st in points in his DGM ride
– Most of Williams 2023 stats aren’t too pretty, but he did get 3 Top 10’s this year
– He ran even worse in the playoffs, but didn’t have many finishes out of the Top 20
– He was able to put together 2 straight Top 10 finishes at one point this year
– Even with a very poor Laps in Top 15% he pulled out a Top 15 in the 4 Short track races
– He ran better at Small tracks and got 1 Top 10 finish, but overall wasn’t great
– Williams again ran poor at Intermediates, but he at least finished half his races in the Top 20
– At Big tracks he neither ran or finished well
– Road Courses were his worst tracks as he ran awful and finished bad as well
– His best tracks were Superspeedway’s were he got 2 Top 10’s and 3 Top 15’s, but he didn’t run good during the races