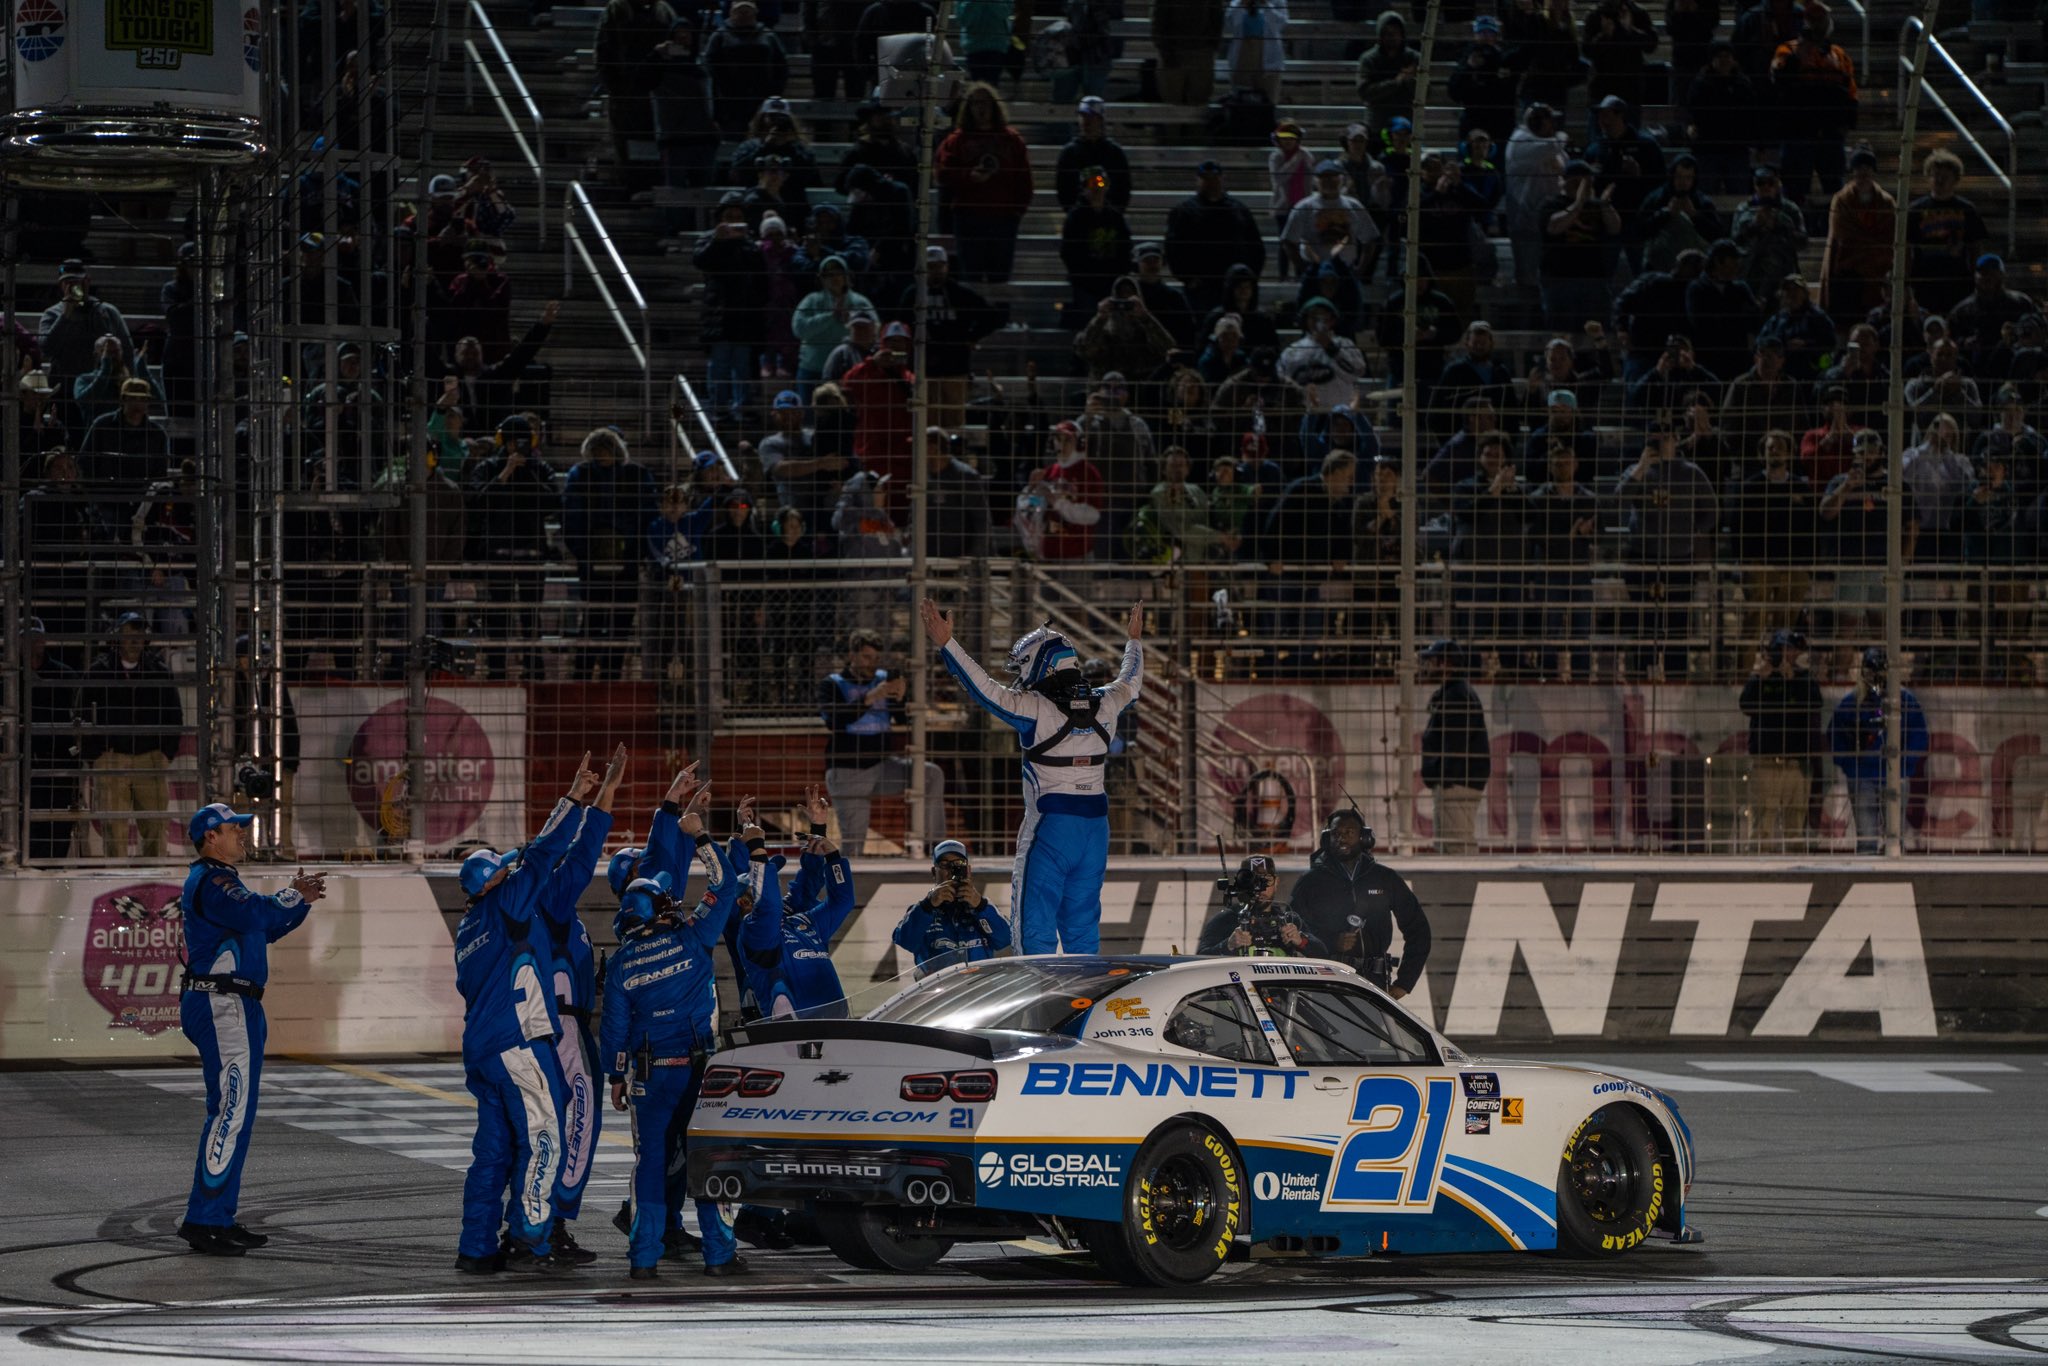
1st in Points – Austin Hill
| Category | Statistic | 2024 Rank | ªRank Thru 2 Races |
| Avg. Fin.¹ | 1.0 | 1st of 44 | T1st of 422 |
| Best Fin. | 1st | — | — |
| Worst Fin. | 1st | — | — |
| Completed Laps%¹ | 100% | T1st of 44 | T1st of 422 |
| Laps in Top15%¹ | 87.2% | T8th of 44 | T62nd of 422 |
| Avg. Driver Rating¹ | 116.2 | 1st of 44 | 18th of 422‡ |
| Wins | 2 | 1st of 44 | 1st of 422 |
| Poles | 0 | T2nd of 44 | T13th of 422 |
| Top 2’s | 2 | 1st of 44 | T1st of 422 |
| Top 3’s | 2 | 1st of 44 | T1st of 422 |
| Top 5’s | 2 | T1st of 44 | T1st of 422 |
| Top 10’s | 2 | T1st of 44 | T1st of 422 |
| Finish out Top 20¹ | 0 | T1st of 44 | T1st of 422 |
| DNF’s¹ | 0 | T1st of 44 | T1st of 422 |
| Stage Wins | 1 | 2nd of 44 | T8th of 367* |
| Stage T10s | 3 | T5th of 44 | T23rd of 367* |
| Stage Pts | 22 | 2nd of 44 | T14th of 367* |
| Avg. Stage Fin.¹ | 6.5 | T4th of 44 | — |
| Playoff Pts² | 11 | 1st of 44 | 1st of 367* |
ªSince Playoffs started in 2016
¹Ranks of drivers to start 45% of races thru 2 races
²Earned from races only, does not reflect penalties
*Stage racing started in 2017
‡Max Driver Rating is 150.0
- Notable Streaks this year/active streaks
- 2 straight Wins (active streak, longest streak in Xfinity Series this year and tied 15th longest streak all-time)
- 2 straight Top 2 finishes (active streak, longest active streak, longest streak in Xfinity Series this year)
- 2 straight Top 3 finishes (active streak, longest active streak, longest streak in Xfinity Series this year)
- 2 straight Top 5 finishes (active streak, tied longest streak in Xfinity Series this year)
- 3 straight Top 10 finishes (active streak)
- 2 straight Top 10 finishes this year (active streak, tied longest streak in Xfinity Series this year)
- 2 straight Stage T10’s
- Notable Las Vegs Streaks
- 3 straight Top 10 finishes (active streak)
- 7 straight Stage T10’s (2022.03 s1-2023.30 s1) (tied 8th longest streak in Xfinity Series all-time)
- 2023 Intermediate Stats (Avg. Fin. and Driver Rating rank among drivers with 1+ Intermediate start, 74 drivers)
- 9 Races, Avg. Finish 4.22(4th), 93.91% of Laps ran in Top15(7th), Avg. Driver Rating 108.89(6th), Best 1st, Worst 7th, Laps Completed 100%, Led 3.07% of laps he ran, 1 Win, 0 Poles, 2 Top 3’s, 7 Top 5’s, 9 Top 10’s, 9 Top 15’s, 0 Finishes out of Top 20, 0 DNF’s, 1 Stage Win, 5.22 Stage Pts Per Stage
- Las Vegas Statistics
- 2023 Fall Las Vegas Race
- Finished 7th, Started 10th, Led 0 laps, Finished 5th in Stage 1, ran 187 Laps in Top 15(93.03% of laps ran), had 100.9 Driver Rating (ranked 7th)
- Notable Las Vegas Statistics over last 5 years (Ranks are of drivers with 1+ start this year and 1+ start at Las Vegas since 2019, 35 drivers)
- 5 Races
- 12.4 Avg. Finish (Ranks 8th)
- Best Finish: 1st, Worst: 31st
- Completed 98.7% of laps (% ranks 11th)
- 78.56% of Laps ran in Top15 (% ranks 11th)
- 98.1 Average Driver Rating (Ranks 7th)
- Led 3.44% of laps he’s run (% ranks 7th)
- 1 Win, 20.0% (% ranks 2nd)
- 3 Top 10’s, 60.0% (% ranks T7th)
- 1 finish outside Top 20, 20.0% (% ranks T8th)
- 1 DNF, 20.0% (% ranks T20th)
- 1 Stage Win, 10.0% (% ranks T3rd)
- 7 Stage T10’s, 70.0% (% ranks 9th)
- 5.1 Stage Pts Per Stage (Ranks 3rd)
– Austin Hill is notable because of his 2024 stats thru 2 races
– At Atlanta last week Hill ran all 169 laps in the Top 15, but he got just 3 Stage Pts and led only 2 laps en route to winning at Atlanta again
– Through 2 races in 2024 he has 2 wins, the most Playoff Pts through 2 races in Xfinity history, and his worst 2024 Rank is just 8th (87.2 Laps in Top 15%)
– He is now on a 2 race Win streak and a 3 race Top 10 streak
– At Las Vegas he is on a 3 race Top 10 streak and before the last stage competed in here he was on a 7 straight Stage T10 streak
– In the 9 Intermediate races last year he ran 94% of his laps in the Top 15, had 7 Top 5’s, and a worst finish of only 7th
– Last Fall at Las Vegas Hill led 0 laps, but he had the 7th best Driver Rating and finished 7th in the race
– In his last 5 races here at Las Vegas he has a 12.4 Avg. Finish with a 98.1 Avg. Driver Rating, 5.1 Stage Pts Per Stage, and his only finish out of the Top 20 was a DNF
Outlook for this weekend
Austin Hill has started the year 2 for 2 after winning both Superspeedway races to start the 2024 season. Thus, his stats this year are pretty outstanding, it gets worse for the competition when you see his Intermediate stats from last year. Hill was exceptional at these tracks and at Las Vegas he’s done well over the last 5 years, but not great. This weekend I see being no different from last year as Hill has a good chance to start 3 for 3.
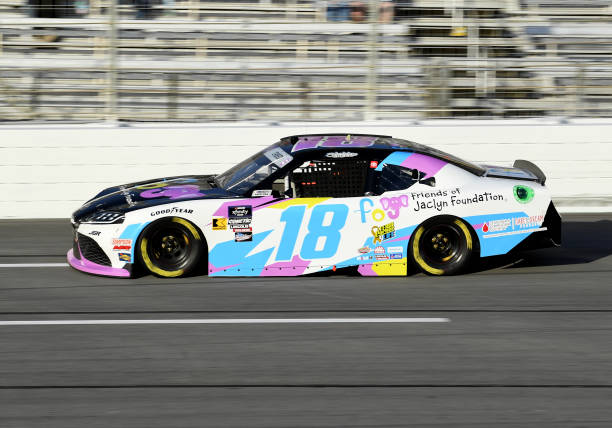
2nd in Points – Sheldon Creed
| Category | Statistic | 2024 Rank | ªRank Thru 2 Races |
| Avg. Fin.¹ | 3.0 | 2nd of 44 | T15th of 422 |
| Best Fin. | 2nd | — | — |
| Worst Fin. | 4th | — | — |
| Completed Laps%¹ | 100% | T1st of 44 | T1st of 422 |
| Laps in Top15%¹ | 66.78% | 13th of 44 | 118th of 422 |
| Avg. Driver Rating¹ | 95.7 | 6th of 44 | 68th of 422‡ |
| Wins | 0 | T2nd of 44 | T18th of 422 |
| Poles | 0 | T2nd of 44 | T13th of 422 |
| Top 2’s | 1 | T2nd of 44 | T4th of 422 |
| Top 3’s | 1 | T2nd of 44 | T7th of 422 |
| Top 5’s | 2 | T1st of 44 | T1st of 422 |
| Top 10’s | 2 | T1st of 44 | T1st of 422 |
| Finish out Top 20¹ | 0 | T1st of 44 | T1st of 422 |
| DNF’s¹ | 0 | T1st of 44 | T1st of 422 |
| Stage Wins | 0 | T3rd of 44 | T25th of 367* |
| Stage T10s | 4 | T1st of 44 | T1st of 367* |
| Stage Pts | 17 | 6th of 44 | T30th of 367* |
| Avg. Stage Fin.¹ | 6.75 | 6th of 44 | — |
| Playoff Pts² | 0 | T3rd of 44 | T24th of 367* |
ªSince Playoffs started in 2016
¹Ranks of drivers to start 45% of races thru 2 races
²Earned from races only, does not reflect penalties
*Stage racing started in 2017
‡Max Driver Rating is 150.0
- Notable Streaks this year/active streaks
- 4 straight Top 5 finishes (active streak, longest active streak in Xfinity Series)
- 2 straight Top 5 finishes this year (active streak, tied longest streak in Xfinity Series this year)
- 4 straight Top 10 finishes (active streak, longest active streak in Xfinity Series)
- 2 straight Top 10 finishes this year (active streak, tied longest streak in Xfinity Series this year)
- 5 straight Stage T10’s (active streak)
- 4 straight Stage T10’s this year (tied longest streak in Xfinity Series this year)
- Notable Las Vegs Streaks
- 2 straight Stage T10’s (2023.03 s1&s2)
- 2023 Intermediate Stats (Avg. Fin. and Driver Rating rank among drivers with 1+ Intermediate start, 74 drivers)
- 9 Races, Avg. Finish 15.44(T20th), 74.9% of Laps ran in Top15(25th), Avg. Driver Rating 82.5(23rd), Best 3rd, Worst 28th, Laps Completed 99.59%, Led 0.24% of laps he ran, 0 Wins, 0 Poles, 1 Top 3, 1 Top 5, 4 Top 10’s, 5 Top 15’s, 3 Finishes out of Top 20, 0 DNF’s, 0 Stage Wins, 1.89 Stage Pts Per Stage
- Las Vegas Statistics
- 2023 Fall Las Vegas Race
- Finished 15th, Started 15th, Led 0 laps, ran 191 Laps in Top 15(95.5% of laps ran), had 79.5 Driver Rating (ranked 14th)
- Notable Las Vegas Statistics over last 5 years (Ranks are of drivers with 1+ start this year and 1+ start at Las Vegas since 2019, 35 drivers)
- 4 Races
- 17.0 Avg. Finish (Ranks T12th)
- Best Finish: 7th, Worst: 37th
- Completed 81.3% of laps (% ranks 27th)
- 88.96% of Laps ran in Top15 (% ranks 10th)
- 78.0 Average Driver Rating (Ranks 13th)
- Led 0.77% of laps he’s run (% ranks 10th)
- 0 Top 5’s
- 2 Top 10’s, 50.0% (% ranks 9th)
- 3 Top 15’s, 75.0% (% ranks T8th)
- 1 finish outside Top 20, 25.0% (% ranks T12th)
- 1 DNF, 25.0% (% ranks 26th)
- 0 Stage Wins
- 2 Stage T10’s, 25.0% (% ranks T12th)
– Sheldon Creed is notable because he’s 2nd in points
– Last week Creed ran only 55% of his laps in the Top 15 and he got just 4 Stage Pts, but his fuel strategy worked out to get him a 4th place finish
– He has the 2nd best Avg. Finish in 2024 with the 6th best Avg. Stage Finish, Avg. Driver Rating, and 6th most Stage Pts
– After Atlanta he is now on a 4 race Top 5 streak and 5 straight Stage T10 streak dating back to last year (both longest active streaks)
– The only streak of mention for him at Las Vegas is that he had 2 straight Stage T10’s in last years Spring race
– Intermediates as a whole weren’t great for him last year as most of his finishes were out of the Top 10, he had the 23rd best Avg. Driver Rating, and he only got 1.89 Stage Pts Per Stage
– In the last Xfinity race at Las Vegas Creed ran 96% of his laps in the Top 15, but he finished 15th with the 14th best Driver Rating
– He has 4 Xfinity starts at Las Vegas in the last 5 years getting just a 17.0 Avg. Finish in them, but he does have 2 Top 10’s and has ran 89% of his laps in the Top 15. However, he also has just 2 Stage T10’s
Outlook for this weekend
Sheldon Creed was able to continue his Top 5 finish streak at Atlanta last week and extend it to 4 races. The only thing he hasn’t done great this year is running in the Top 15, and based on the 2023 results going to an Intermediate track isn’t great for him. Last year he ran decent on these tracks but finished Top 10 in less than half the races. Las Vegas stats are better for him as half his finishes have come in the Top 10, but with a best finish of only 7th. All in all Creed’s Top 5 streak might come to an end this week, but the Top 10 streak could live on.
3rd in Points – Riley Herbst

| Category | Statistic | 2024 Rank | ªRank Thru 2 Races |
| Avg. Fin.¹ | 10.5 | 7th of 44 | T87th of 422 |
| Best Fin. | 6th | — | — |
| Worst Fin. | 15th | — | — |
| Completed Laps%¹ | 99.65% | T12th of 44 | T141st of 422 |
| Laps in Top15%¹ | 92.04% | T3rd of 44 | T42nd of 422 |
| Avg. Driver Rating¹ | 107.75 | 2nd of 44 | 35th of 422‡ |
| Wins | 0 | T2nd of 44 | T18th of 422 |
| Poles | 0 | T2nd of 44 | T13th of 422 |
| Top 2’s | 0 | T4th of 44 | T34th of 422 |
| Top 3’s | 0 | T6th of 44 | T49th of 422 |
| Top 5’s | 0 | T7th of 44 | T75th of 422 |
| Top 10’s | 1 | T5th of 44 | T38th of 422 |
| Finish out Top 20¹ | 0 | T1st of 44 | T1st of 422 |
| DNF’s¹ | 0 | T1st of 44 | T1st of 422 |
| Stage Wins | 0 | T3rd of 44 | T25th of 367* |
| Stage T10s | 3 | T5th of 44 | T23rd of 367* |
| Stage Pts | 21 | 3rd of 44 | T17th of 367* |
| Avg. Stage Fin.¹ | 5.75 | T1st of 44 | — |
| Playoff Pts² | 0 | T3rd of 44 | T24th of 367* |
ªSince Playoffs started in 2016
¹Ranks of drivers to start 45% of races thru 2 races
²Earned from races only, does not reflect penalties
*Stage racing started in 2017
‡Max Driver Rating is 150.0
- Notable Streaks this year/active streaks
- 3 straight Stage T10’s (active streak)
- Notable Las Vegs Streaks
- 1 straight Win (active “streak”)
- 2 straight Top 10 finishes (active streak)
- 1 straight Stage Win (active “streak”)
- 4 straight Stage T10’s (active streak, tied longest active streak in Xfinity Series at Las Vegas)
- 5 straight Stage T10’s (2020.02 s1-2021.04 s1)
- 2023 Intermediate Stats (Avg. Fin. and Driver Rating rank among drivers with 1+ Intermediate start, 74 drivers)
- 9 Races, Avg. Finish 14.56(19th), 80.99% of Laps ran in Top15(18th), Avg. Driver Rating 86.27(16th), Best 1st, Worst 38th, Laps Completed 81.15%, Led 7.5% of laps he ran, 1 Win, 0 Poles, 3 Top 3’s, 3 Top 5’s, 5 Top 10’s, 6 Top 15’s, 3 Finishes out of Top 20, 2 DNF’s, 1 Stage Win, 2.44 Stage Pts Per Stage
- Las Vegas Statistics
- 2023 Fall Las Vegas Race
- Finished 1st, Started 8th, Led 103 laps(51.24%), Finished 10th in Stage 1 and 1st in Stage 2, ran 176 Laps in Top 15(87.56% of laps ran), had 140.2 Driver Rating (ranked 1st)
- Notable Las Vegas Statistics over last 5 years (Ranks are of drivers with 1+ start this year and 1+ start at Las Vegas since 2019, 35 drivers)
- 9 Races
- 16.0 Avg. Finish (Ranks 11th)
- Best Finish: 1st, Worst: 40th
- Completed 82.47% of laps (% ranks 26th)
- 90.52% of Laps ran in Top15 (% ranks 9th)
- 86.08 Average Driver Rating (Ranks 10th)
- Led 6.93% of laps he’s run (% ranks 5th)
- 1 Win, 11.11% (% ranks 3rd)
- 4 Top 10’s, 44.44% (% ranks 10th)
- 6 Top 15’s, 66.67% (% ranks 10th)
- 2 finishes outside Top 20, 22.22% (% ranks 11th)
- 2 DNF’s, 22.22% (% ranks 25th)
- 1 Stage Win, 5.56% (% ranks 6th)
- 9 Stage T10’s, 50.0% (% ranks 11th)
– Riley Herbst is notable because of how well he dominated the last Xfinity race at Las Vegas
– Herbst ran 96% of his laps last week in the Top 15 and was poised for a good finish before the fuel bug bit and caused him to finish 15th
– He has the 7th best Avg. Finish thru 2 races this year with 0 Top 5’s, but he has the 3rd most Stage Pts (21) and is tied for the best Avg. Stage Finish (5.75)
– After Atlanta the only notable streak he has is the 3 straight Stage T10 streak he is currently on
– At Las Vegas he is on a 2 race Top 10 streak and a 4 straight Stage T10 streak as well
– In the 9 Xfinity Intermediate races last year he ran 81% of his laps in the Top 15 with 1 Win and 3 Top 3’s, but he also had 3 finishes out of the Top 20 and a 14.56 Avg. Finish
– Herbst dominated the last Xfinity race at Las Vegas as he led over half the race, had an impressive 140.2 Driver Rating, and won his first Xfinity race
– His win last year is his only Top 5 in his last 9 races here and more than half his races here have finished out of the Top 10, but he’s ran 91% of his laps here in the Top 15 and his only finishes out of the Top 20 have been DNF’s
Outlook for this weekend
Riley Herbst was one of the unfortunate victims of bad fuel mileage last week at Atlanta which cost him a good finish. This has hurt his 2024 stats, but the nice thing for him is that this week is an Intermediate where he finished a third of his races last year in the Top 3. Even better news is this is Las Vegas where, even though he hasn’t run great in his career, he dominated last time the Xfinity Series came here. Although all of this isn’t great I would expect a decent run from Herbst with a good to great finish in store as well.
4th in Points – Chandler Smith
| Category | Statistic | 2024 Rank | ªRank Thru 2 Races |
| Avg. Fin.¹ | 3.5 | 3rd of 44 | T22nd of 422 |
| Best Fin. | 2nd | — | — |
| Worst Fin. | 5th | — | — |
| Completed Laps%¹ | 100% | T1st of 44 | T1st of 422 |
| Laps in Top15%¹ | 87.2% | T8th of 44 | T62nd of 422 |
| Avg. Driver Rating¹ | 88.8 | 11th of 44 | 96th of 422‡ |
| Wins | 0 | T2nd of 44 | T18th of 422 |
| Poles | 0 | T2nd of 44 | T13th of 422 |
| Top 2’s | 1 | T2nd of 44 | T4th of 422 |
| Top 3’s | 1 | T2nd of 44 | T7th of 422 |
| Top 5’s | 2 | T1st of 44 | T1st of 422 |
| Top 10’s | 2 | T1st of 44 | T1st of 422 |
| Finish out Top 20¹ | 0 | T1st of 44 | T1st of 422 |
| DNF’s¹ | 0 | T1st of 44 | T1st of 422 |
| Stage Wins | 0 | T3rd of 44 | T25th of 367* |
| Stage T10s | 1 | T12th of 44 | T104th of 367* |
| Stage Pts | 5 | 15th of 44 | T96th of 367* |
| Avg. Stage Fin.¹ | 13.75 | 13th of 44 | — |
| Playoff Pts² | 0 | T3rd of 44 | T24th of 367* |
ªSince Playoffs started in 2016
¹Ranks of drivers to start 45% of races thru 2 races
²Earned from races only, does not reflect penalties
*Stage racing started in 2017
‡Max Driver Rating is 150.0
- Notable Streaks this year/active streaks
- 2 straight Top 5 finishes (active streak, tied longest streak in Xfinity Series this year)
- 3 straight Top 10 finishes (active streak)
- 2 straight Top 10 finishes this year (active streak, tied longest streak in Xfinity Series this year)
- Notable Las Vegs Streaks
- 2 straight Top 5 finishes (active streak, longest active streak in Xfinity Series at Las Vegas)
- 4 straight Stage T10’s (active streak, tied longest active streak in Xfinity Series at Las Vegas)
- 2023 Intermediate Stats (Avg. Fin. and Driver Rating rank among drivers with 1+ Intermediate start, 74 drivers)
- 9 Races, Avg. Finish 16.67(T25th), 82.93% of Laps ran in Top15(14th), Avg. Driver Rating 92.28(10th), Best 3rd, Worst 36th, Laps Completed 90.72%, Led 14.01% of laps he ran, 0 Wins, 1 Pole, 1 Top 3, 3 Top 5’s, 3 Top 10’s, 6 Top 15’s, 3 Finishes out of Top 20, 2 DNF’s, 1 Stage Win, 3.44 Stage Pts Per Stage
- Las Vegas Statistics
- 2023 Fall Las Vegas Race
- Finished 4th, Started 4th, Led 23 laps(11.44%), Finished 2nd in Stage 1 and 6th in Stage 2, ran 197 Laps in Top 15(98.01% of laps ran), had 116.3 Driver Rating (ranked 4th)
- Notable Las Vegas Statistics over last 5 years (Ranks are of drivers with 1+ start this year and 1+ start at Las Vegas since 2019, 35 drivers)
- 2 Races
- 3.5 Avg. Finish (Ranks 1st)
- Best Finish: 3rd, Worst: 4th
- Completed 100% of laps (% ranks T1st)
- 98.5% of Laps ran in Top15 (% ranks 1st)
- 126.35 Average Driver Rating (Ranks 1st)
- Led 35.16% of laps he’s run (% ranks 1st)
- 1 Pole, 50.0% (% ranks T1st)
- 0 Top 2’s
- 1 Top 3, 50.0% (% ranks 1st)
- 2 Top 5’s, 100% (% ranks 1st)
- 0 finishes outside Top 20, 0.00% (% ranks T1st)
- 0 DNF’s, 0.00% (% ranks T1st)
- 0 Stage Wins
- 4 Stage T10’s, 100% (% ranks T1st)
- 6.5 Stage Pts Per Stage (Ranks 2nd)
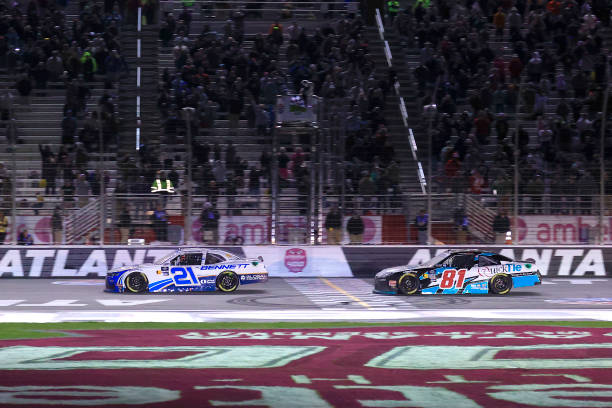
– Chandler Smith is notable because of his Xfinity stats at Las Vegas over the last 5 years
– Last week at Atlanta Smith ran all but 3 laps in the Top 15 and was there to pounce and steal the win from Austin Hill if he ran out of fuel
– He has the 3rd best Avg. Finish this year (3.5) with 2 Top 5’s, but he has just the 11th best Avg. Driver Rating with 1 Stage T10 and the 13th best Avg. Stage Finish (13.75)
– After Atlanta he is now on a 3 race Top 10 streak and 2 race Top 5 streak
– He’s only ran 2 Xfinity races at Las Vegas but in both he’s finished in the Top 5 and Top 10 in all 4 stages, leading to his good Las Vegas streaks
– In the 9 2023 Intermediate races he had 1 Top 3 and 3 Top 5’s, but also just 3 Top 10’s. In total he had 16.67 Avg. Finish, but also the 10th best Avg. Driver Rating
– Last Fall at Las Vegas 4’s were wild as Smith started 4th, had an Avg. Stage Finish of 4th, had the 4th best Driver Rating, and finished the race in 4th
– He’s only ran 2 Xfinity races at Las Vegas but in those races he’s ran 99% of his laps in the Top 15, has an outstanding 126.35 Avg. Driver Rating, and 2 Top 5’s with 6.5 Stage Pts Per Stage
Outlook for this weekend
Chandler Smith is starting 2024 with a couple of great finishes, but he’s been pretty bad in stages. The good news for him is that an Intermediate track is next on the docket where he was decently good in stages and had 3 Top 5 finishes last year. Unfortunately he also had just 3 Top 10’s, but two of these good finishes were at Las Vegas. In the last 5 years he’s ran just 2 races at Las Vegas but both were great runs ending in a Top 5. All in all this weekend is looking up for Smith, so look for him to run well and either be Top 5 or bust in terms of finish.
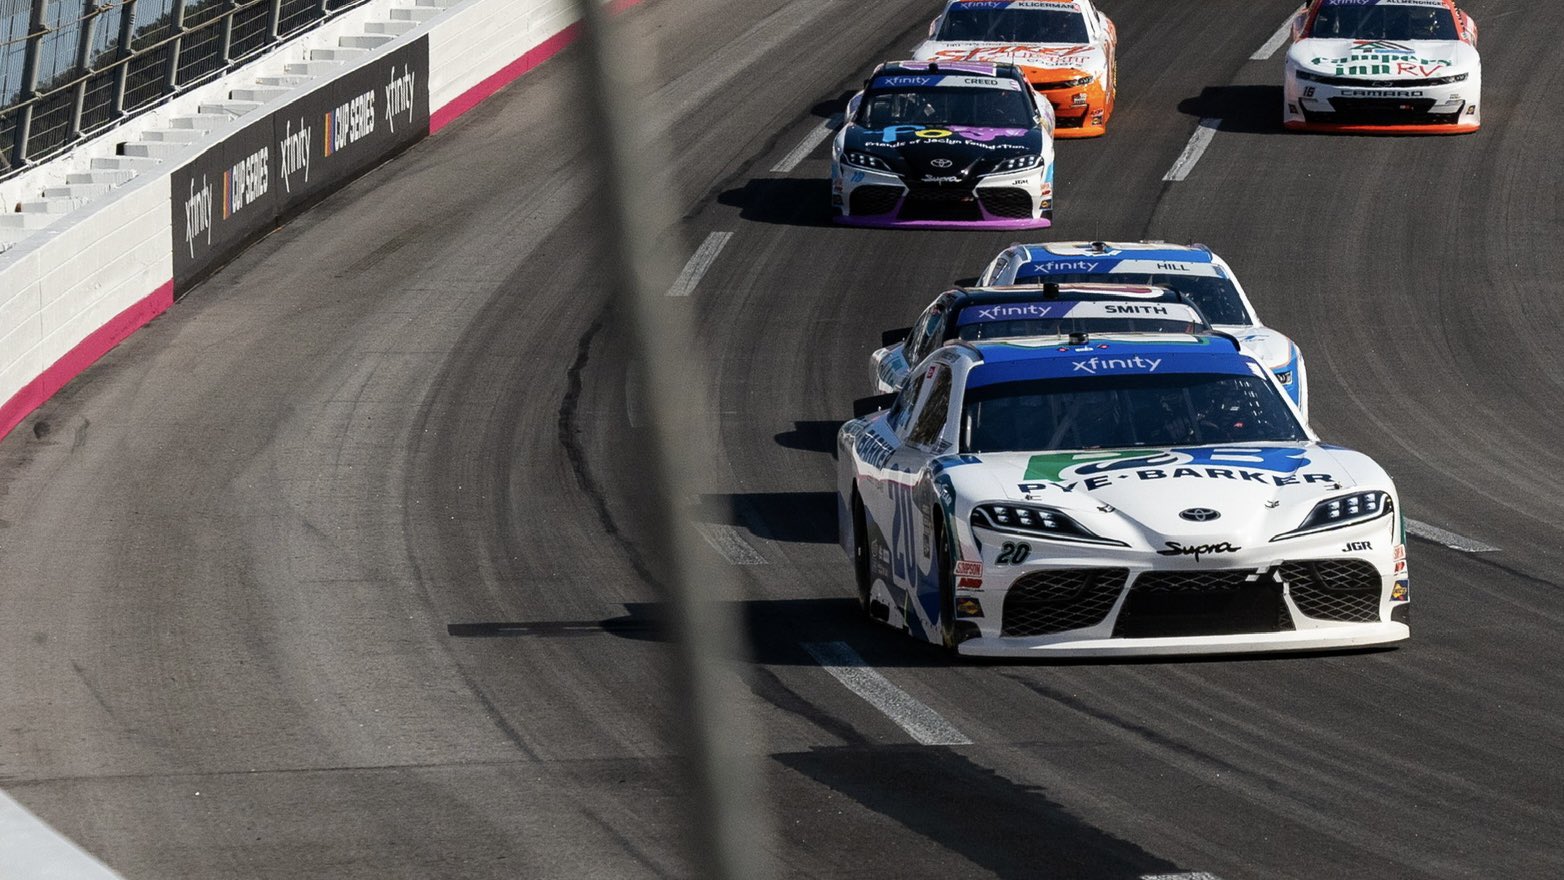
18th in Owner Points – John Hunter Nemechek
| Category | Statistic | 2024 Rank | ªRank Thru 2 Races |
| Avg. Fin.¹ | 19.5 | T20th of 44 | T191st of 422 |
| Best Fin. | 7th | — | — |
| Worst Fin. | 32nd | — | — |
| Completed Laps%¹ | 98.62% | T25th of 44 | T214th of 422 |
| Laps in Top15%¹ | 47.75% | 17th of 44 | 162nd of 422 |
| Avg. Driver Rating¹ | 85.7 | 13th of 44 | 111th of 422‡ |
| Wins | 0 | T2nd of 44 | T18th of 422 |
| Poles | 0 | T2nd of 44 | T13th of 422 |
| Top 2’s | 0 | T4th of 44 | T34th of 422 |
| Top 3’s | 0 | T6th of 44 | T49th of 422 |
| Top 5’s | 0 | T7th of 44 | T75th of 422 |
| Top 10’s | 1 | T5th of 44 | T38th of 422 |
| Finish out Top 20¹ | 1 | T15th of 44 | T153rd of 422 |
| DNF’s¹ | 0 | T1st of 44 | T1st of 422 |
| Stage Wins | 0 | T3rd of 44 | T25th of 367* |
| Stage T10s | 1 | T12th of 44 | T104th of 367* |
| Stage Pts | 0 | T17th of 44 | T117th of 367* |
| Avg. Stage Fin.¹ | 21.25 | 22nd of 44 | — |
| Playoff Pts² | 0 | T3rd of 44 | T24th of 367* |
ªSince Playoffs started in 2016
¹Ranks of drivers to start 45% of races thru 2 races
²Earned from races only, does not reflect penalties
*Stage racing started in 2017
‡Max Driver Rating is 150.0
- Notable Streaks this year/active streaks
- none (all have been 1 and done)
- Notable Las Vegs Streaks
- 1 straight Top 2 finish (active “streak”)
- 2 straight Top 10 finishes (active streak)
- 2 straight Stage T10’s (active streak)
- 4 straight Stage T10’s (2019.03 s1-2019.26 s2)
- 2023 Intermediate Stats (Avg. Fin. and Driver Rating rank among drivers with 1+ Intermediate start, 74 drivers)
- 9 Races, Avg. Finish 3.22(3rd), 94.44% of Laps ran in Top15(5th), Avg. Driver Rating 126.5(2nd), Best 1st, Worst 6th, Laps Completed 100%, Led 27.01% of laps he ran, 2 Wins, 2 Poles, 6 Top 3’s, 7 Top 5’s, 9 Top 10’s, 9 Top 15’s, 0 Finishes out of Top 20, 0 DNF’s, 6 Stage Wins, 7.61 Stage Pts Per Stage
- Las Vegas Statistics
- 2023 Fall Las Vegas Race
- Finished 2nd, Started 38th, Led 0 laps, Finished 6th in Stage 1 and 3rd in Stage 2, ran 189 Laps in Top 15(94.03% of laps ran), had 119 Driver Rating (ranked 3rd)
- Notable Las Vegas Statistics over last 5 years (Ranks are of drivers with 1+ start this year and 1+ start at Las Vegas since 2019, 35 drivers)
- 6 Races
- 7.67 Avg. Finish (Ranks 3rd)
- Best Finish: 2nd, Worst: 16th
- Completed 99.84% of laps (% ranks 4th)
- 92.0% of Laps ran in Top15 (% ranks 8th)
- 102.45 Average Driver Rating (Ranks 5th)
- Led 3.71% of laps he’s run (% ranks 6th)
- 0 Wins
- 2 Top 2’s, 33.33% (% ranks 1st)
- 4 Top 10’s, 66.67% (% ranks 6th)
- 5 Top 10’s, 83.33% (% ranks 6th)
- 0 finishes outside Top 20, 0.00% (% ranks T1st)
- 0 DNF’s, 0.00% (% ranks T1st)
- 1 Stage Win, 8.33% (% ranks 5th)
- 10 Stage T10’s, 83.33% (% ranks 6th)
- 3.42 Stage Pts Per Stage (Ranks 9th)
– John Hunter Nemechek is notable because of his stats on Intermediate tracks in 2023
– At Atlanta Nemechek had troubles in Stage 2 that caused him to just run 40% of his laps in the Top 15 and end up finishing 32nd
– In 2024 he has 1 Top 10 and a 19.5 Avg. Finish. However, this is still better than his 1 Stage T10 and 21.25 Avg. Stage Finish
– Because of what happened last race he has no streaks to speak of this year
– In terms of Las Vegas he is on a 2 race Top 10 streak and has 2 straight Stage T10’s as well
– He was excellent on Intermediates last year as he had a worst finish of 6th in 9 races with 2 Wins and 6 Top 3’s, not to mention his 6 Stage Wins and 7.61 Stage Pts Per Stage
– In the 2023 Fall Xfinity race at Las Vegas Nemechek ran 94% of his laps in the Top 15 and had the 3rd best Driver Rating in the race, finishing 2nd
– In the last 5 years he has ran 6 Xfinity races at Las Vegas getting a 7.67 Avg. Finish (3rd best) with 2 Top 2’s and 10 Stage T10’s, but 0 Wins
Outlook for this weekend
John Hunter Nemechek hasn’t exactly had the 2024 Xfinity season he’s wanted so far thanks to some misfortune at Atlanta. However, this week is an Intermediate track where Nemechek dominated at last year finishing no worse than 6th. Even worse for the competition is that this is Las Vegas where he has a 102.45 Avg. Driver Rating in the last 5 years, but he has yet to win in those 6 starts. Overall I think Nemechek ends up being the favorite when you take all the stats into account and probably ends up with a great finish.


