Note: any driver in 3 straight Truck outlook articles is not in consideration for the next two, or any driver in 3 of 4 Truck outlook articles is not in consideration for the next one. This resets after they are put back into consideration.
This week not in consideration: Grant Enfinger (3 of 4)
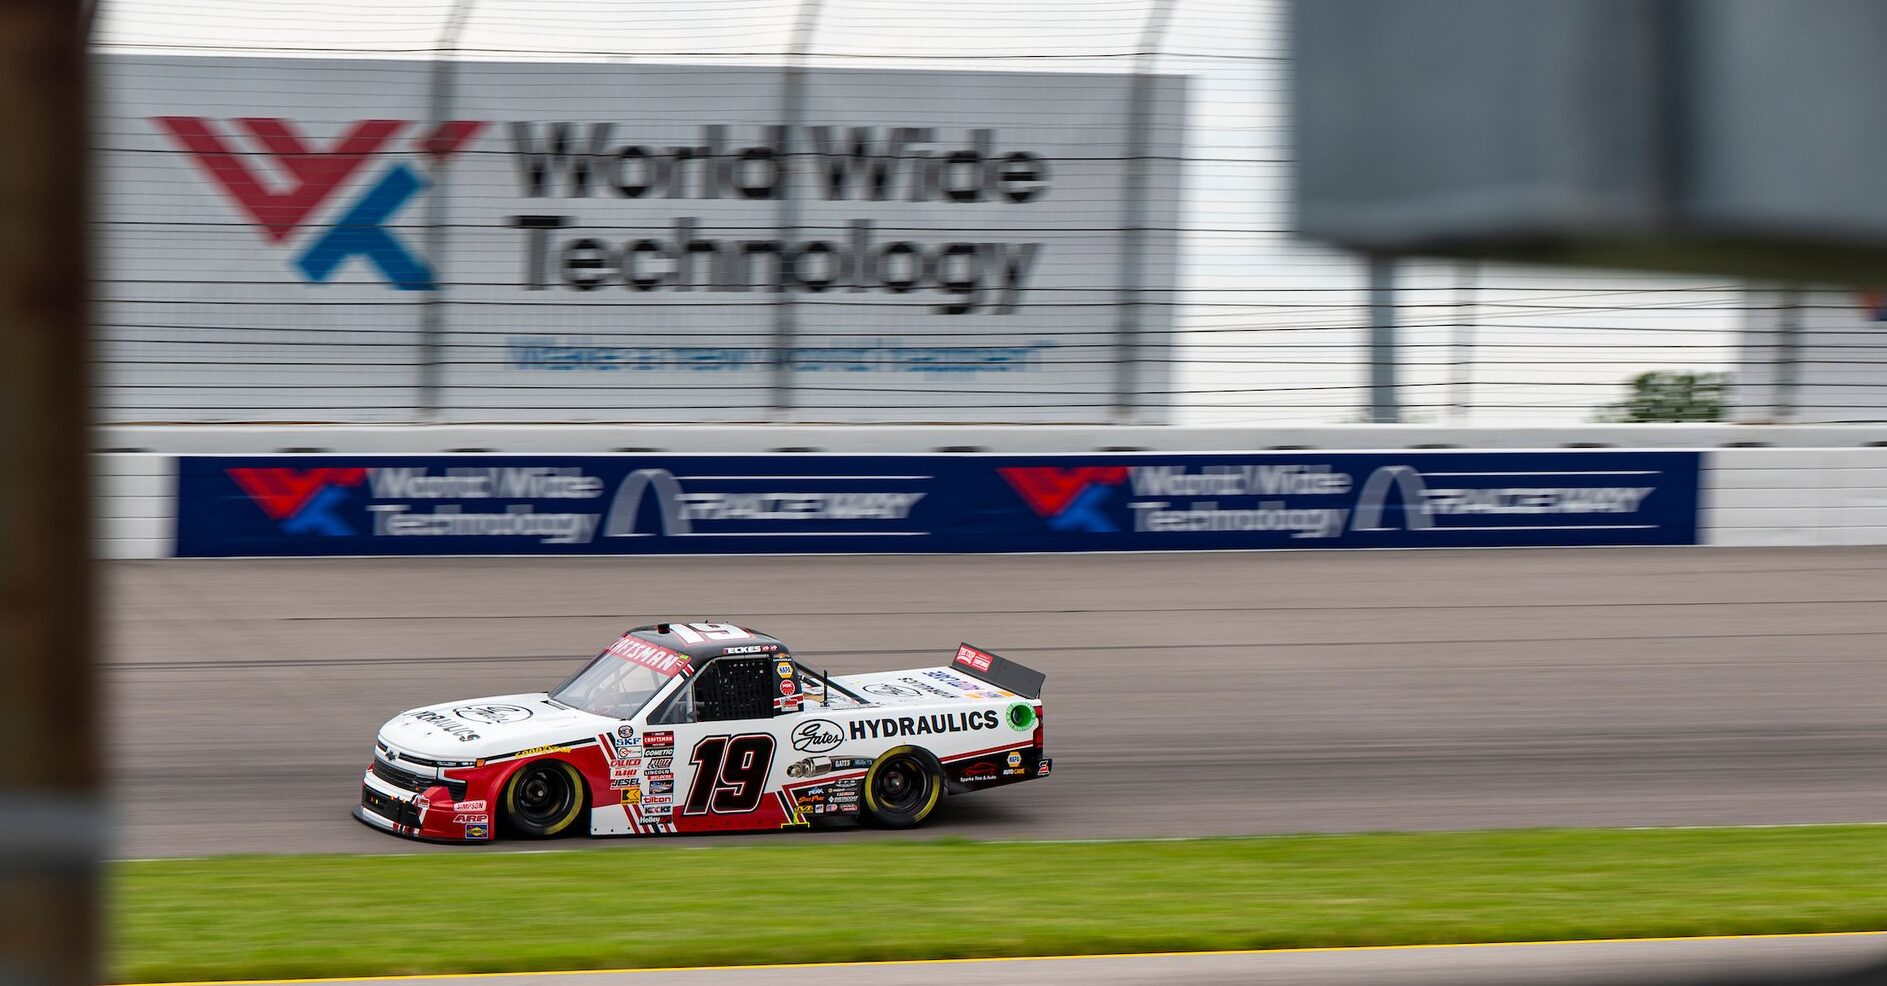
1st in Points – Christian Eckes
| Category | Statistic | 2024 Rank | ªRank Thru 12 Races |
| Avg. Fin.¹ | 7.25 | 2nd of 30 | 7th of 264 |
| Best Fin. | 1st | — | — |
| Worst Fin. | 32nd | — | — |
| Completed Laps%¹ | 95.43% | 19th of 30 | 121st of 264 |
| Laps in Top15%¹ | 86.67% | 2nd of 30 | 18th of 264 |
| Avg. Driver Rating¹ | 109.87 | 2nd of 30 | 7th of 264‡ |
| Wins | 2 | T2nd of 69 | T10th of 724 |
| Poles | 1 | T3rd of 69 | T14th of 724 |
| Top 2’s | 3 | T2nd of 69 | T14th of 724 |
| Top 3’s | 4 | 3rd of 69 | T13th of 724 |
| Top 5’s | 6 | 3rd of 69 | T9th of 724 |
| Top 10’s | 11 | 1st of 69 | T1st of 724 |
| Finish out Top 20¹ | 1 | T3rd of 30 | T13th of 264 |
| DNF’s¹ | 1 | T7th of 30 | T46th of 264 |
| Stage Wins | 3 | 4th of 69 | T18th of 642* |
| Stage T10s | 18 | 2nd of 69 | T12th of 642* |
| Stage Pts | 141 | 2nd of 69 | 5th of 642* |
| Avg. Stage Fin.¹ | 6.67 | 1st of 30 | — |
| Playoff Pts² | 13 | 2nd of 69 | T9th of 642* |
ªSince Playoffs started in 2016
¹Ranks of drivers to start 43% of races thru 12 races
²Earned from races only, does not reflect penalties
*Stage racing started in 2017
‡Max Driver Rating is 150.0
- Notable Streaks this year
- 4 straight Top 5 finishes (longest streak in Truck Series this year)
- 10 straight Top 10 finishes (active streak, longest active streak in Truck Series, longest streak in Truck Series this year, and tied 21st longest streak in Truck Series all-time)
- 2 straight Stage Wins (tied longest streak in Truck Series this year and tied 14th longest streak in Truck Series all-time)
- 2 straight Stage T10’s (active streak)
- 10 straight Stage T10’s (tied 30th longest streak in Truck Series all-time)
- Notable Nashville Streaks
- 2 straight Stage T10’s (2022.14 s1&s2) (tied 6th longest streak in Truck Series at Nashville all-time)
- 1 straight Stage T10 (active “streak”)
- 2024 Intermediate Stats (Avg. Fin. and Driver Rating rank among drivers with 1+ Intermediate start, 45 drivers)
- 5 Races, Avg. Finish 5.4(4th), 87.2% of Laps ran in Top15(7th), Avg. Driver Rating 106.6(5th), Best 3rd, Worst 10th, Laps Completed 100%, Led 14.05% of laps he ran, 0 Wins, 0 Poles, 1 Top 3, 3 Top 5’s, 5 Top 10’s, 5 Top 15’s, 0 Finishes out of Top 20, 0 DNF’s, 0 Stage Wins, 5.0 Stage Pts Per Stage, Avg. Stage Finish 7.5
- Nashville Statistics
- 2023 Nashville Race
- Finished 23rd, Started 14th, Led 0 laps, Finished 10th in Stage 2, ran 125 Laps in Top 15(84.46% of laps ran), had 71.2 Driver Rating (ranked 16th)
- Notable Nashville Statistics over last 5 years (Ranks are of drivers with 1+ start this year and 1+ start at Nashville since 2019, 35 drivers)
- 2 Races
- 14.5 Avg. Finish (Ranks 13th)
- Best Finish: 6th, Worst: 23rd
- Completed 99.33% of laps (% ranks T17th)
- 92.28% of Laps ran in Top15 (% ranks 6th)
- 88.8 Average Driver Rating (Ranks 9th)
- Led 0.00% of laps he’s run
- 0 Top 5’s
- 1 Top 10, 50.0% (% ranks T10th)
- 1 finish outside Top 20, 50.0% (% ranks T17th)
- 0 DNF’s, 0.00% (% ranks T1st)
- 0 Stage Wins
- 3 Stage T10’s, 75.0% (% ranks T5th)
- 2.25 Stage Pts Per Stage (Ranks 7th)
– Christian Eckes is notable because he is 1st in points heading to Nashville
– In the last Truck race, Gateway, Eckes ran 98% of his laps in the Top 15, led 2 laps, started 2nd, finished 2nd in Stage 1 and 2, and finished 2nd in the race
– Since 2016 he has the 7th best Avg. Finish (7.25), 7th best Avg. Driver Rating (109.87), 5th most Stage Pts (141), and is tied for most Top 10’s (11) thru 12 races among drivers with 6+ starts
– He is currently on a 10 race Top 10 finish streak, and earlier this year he had a 10 straight Stage T10 streak as well
– The only notable Nashville streaks he has are a 2 straight Stage T10 streak in 2022 and his active 1 straight Stage T10 “streak”
– In the 5 Intermediate races this year he’s gotten 5 Top 10’s with 3 Top 5’s, 5.0 Stage Pts Pts Stage, and he’s led 14% of his laps
– Last year at Nashville Eckes ran 84% of his laps in the Top 15, but he only got 1 Stage Pt and got caught up in a late race wreck to finish 23rd
– He’s ran 2 Truck races here at Nashville with finishes of 6th and 23rd, but he has just an 88.8 Avg. Driver Rating and has led 0 laps
Outlook for this weekend
Christian Eckes stats this year are some of the best stats of anyone thru 12 races, since the Playoffs started for the Trucks in 2016. What’s more is that he has the best Avg. Stage Finish of any driver this year and the most Top 10’s. Even better is that he’s ran very well in the 5 Intermediate races in 2024 and has gotten 3 Top 5’s as well. However, this is Nashville where Eckes struggled last year and overall hasn’t been great. In all, don’t expect a win from Eckes this week, but he could extend his Top 10 streak to 11 straight races.
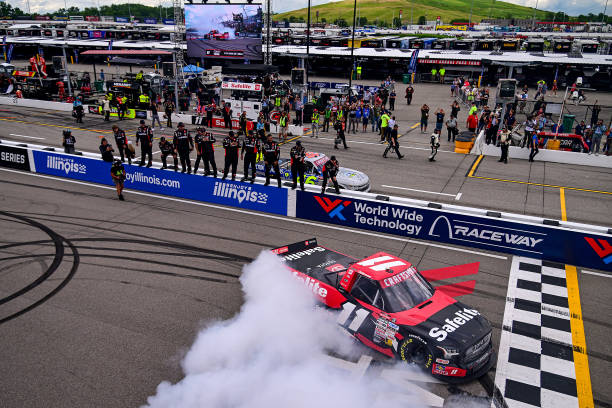
2nd in Points – Corey Heim
| Category | Statistic | 2024 Rank | ªRank Thru 12 Races |
| Avg. Fin.¹ | 7.83 | 3rd of 30 | 10th of 264 |
| Best Fin. | 1st | — | — |
| Worst Fin. | 36th | — | — |
| Completed Laps%¹ | 97.58% | 13th of 30 | 75th of 264 |
| Laps in Top15%¹ | 88.82% | 1st of 30 | 13th of 264 |
| Avg. Driver Rating¹ | 120.14 | 1st of 30 | 1st of 264‡ |
| Wins | 4 | 1st of 69 | T3rd of 724 |
| Poles | 0 | 9th of 69 | T58th of 724 |
| Top 2’s | 6 | 1st of 69 | 1st of 724 |
| Top 3’s | 8 | 1st of 69 | T1st of 724 |
| Top 5’s | 8 | 1st of 69 | T2nd of 724 |
| Top 10’s | 10 | 2nd of 69 | T5th of 724 |
| Finish out Top 20¹ | 2 | T6th of 30 | T51st of 264 |
| DNF’s¹ | 1 | T7th of 30 | T46th of 264 |
| Stage Wins | 4 | 3rd of 69 | T11th of 642* |
| Stage T10s | 17 | 3rd of 69 | T24th of 642* |
| Stage Pts | 109 | 3rd of 69 | T19th of 642* |
| Avg. Stage Fin.¹ | 9.25 | 4th of 30 | — |
| Playoff Pts² | 24 | 1st of 69 | T2nd of 642* |
ªSince Playoffs started in 2016
¹Ranks of drivers to start 43% of races thru 12 races
²Earned from races only, does not reflect penalties
*Stage racing started in 2017
‡Max Driver Rating is 150.0
- Notable Streaks this year
- 2 straight Top 2 finishes (longest streak in Truck Series this year)
- 3 straight Top 3 finishes (longest streak in Truck Series this year)
- 8 straight Top 10 finishes
- 2 straight Stage Wins (tied longest streak in Truck Series this year and tied 14th longest streak in Truck Series all-time)
- 2 straight Stage T10’s (active streak)
- 8 straight Stage T10’s
- Notable Nashville Streaks
- 1 straight Top 5 finish (active “streak”)
- 1 straight Stage Win (active “streak”)
- 4 straight Stage T10’s (active streak, tied 2nd longest streak in Truck Series at Nashville all-time)
- 2024 Intermediate Stats (Avg. Fin. and Driver Rating rank among drivers with 1+ Intermediate start, 45 drivers)
- 5 Races, Avg. Finish 14.0(13th), 97.03% of Laps ran in Top15(2nd), Avg. Driver Rating 129.1(1st), Best 1st, Worst 36th, Laps Completed 93.74%, Led 36.5% of laps he ran, 1 Win, 0 Poles, 3 Top 3’s, 3 Top 5’s, 3 Top 10’s, 3 Top 15’s, 2 Finishes out of Top 20, 1 DNF, 3 Stage Wins, 6.3 Stage Pts Per Stage, Avg. Stage Finish 9.7
- Nashville Statistics
- 2023 Nashville Race
- Finished 4th, Started 4th, Led 57 laps(38.0%), Finished 5th in Stage 1 and 1st in Stage 2, ran 150 Laps in Top 15(100% of laps ran), had 121.9 Driver Rating (ranked 3rd)
- Notable Nashville Statistics over last 5 years (Ranks are of drivers with 1+ start this year and 1+ start at Nashville since 2019, 35 drivers)
- 2 Races
- 18.5 Avg. Finish (Ranks 16th)
- Best Finish: 4th, Worst: 33rd
- Completed 92.0% of laps (% ranks 29th)
- 99.28% of Laps ran in Top15 (% ranks 4th)
- 107.7 Average Driver Rating (Ranks 4th)
- Led 20.65% of laps he’s run (% ranks 2nd)
- 0 Top 3’s
- 1 Top 5, 50.0% (% ranks T5th)
- 1 finish outside Top 20, 50.0% (% ranks T17th)
- 1 DNF, 50.0% (% ranks T32nd)
- 1 Stage Win, 25.0% (% ranks 2nd)
- 4 Stage T10’s, 100% (% ranks T1st)
- 8.0 Stage Pts Per Stage (Ranks 2nd)
– Corey Heim is notable because of his 2024 season stats thru 12 races
– At Gateway Heim only got 12 Stage Pts, but he ran 96% of his laps in the Top 15, 41% of his laps in the lead, and he won the race
– Since 2016 he has the best Avg. Driver Rating (120.14), most Top 2’s (6), and tied most Top 3’s (8) of any driver with 6+ starts thru 12 Truck races
– Earlier in the year he had a 3 race Top 3 streak and an 8 race Top 10 streak, however he is currently only on a 2 straight Stage T10 streak
– At Nashville he is on a 1 race Top 5 “streak” and a 4 straight Stage T10 streak
– He’s finished 3 of the 5 Intermediate races this year in the Top 3 with his other finishes being a DNF and a DQ, but he does have the best Avg. Driver Rating in the 5 races (129.1)
– Heim got 16 Stage Pts at Nashville last year, including a Stage 2 win, while running all 150 laps in the Top 15, leading 38% of the laps, and finishing 4th
– In his 2 Nashville truck starts he has finishes of 4th and 33rd with a DNF, but he’s ran 99% of his laps in the Top 15 and is 4 for 4 in Stage T10’s
Outlook for this weekend
Corey Heim bounced back from his DQ at Charlotte with a convincing win at Gateway earlier this month, and on the year he’s clearly been one of the best drivers. However, there is some hope for the competition in that his Avg. Finish on Intermediates hasn’t been great this year, but that’s mainly due to his DQ and a DNF as he’s ran terrific in the 5 races. Moreover, this weekend is Nashville where he’s ran great in his 2 starts, but again doesn’t have a great Avg. Finish. Overall, Heim is a shoe-in for a great run this weekend, but a win may not be in the cards.
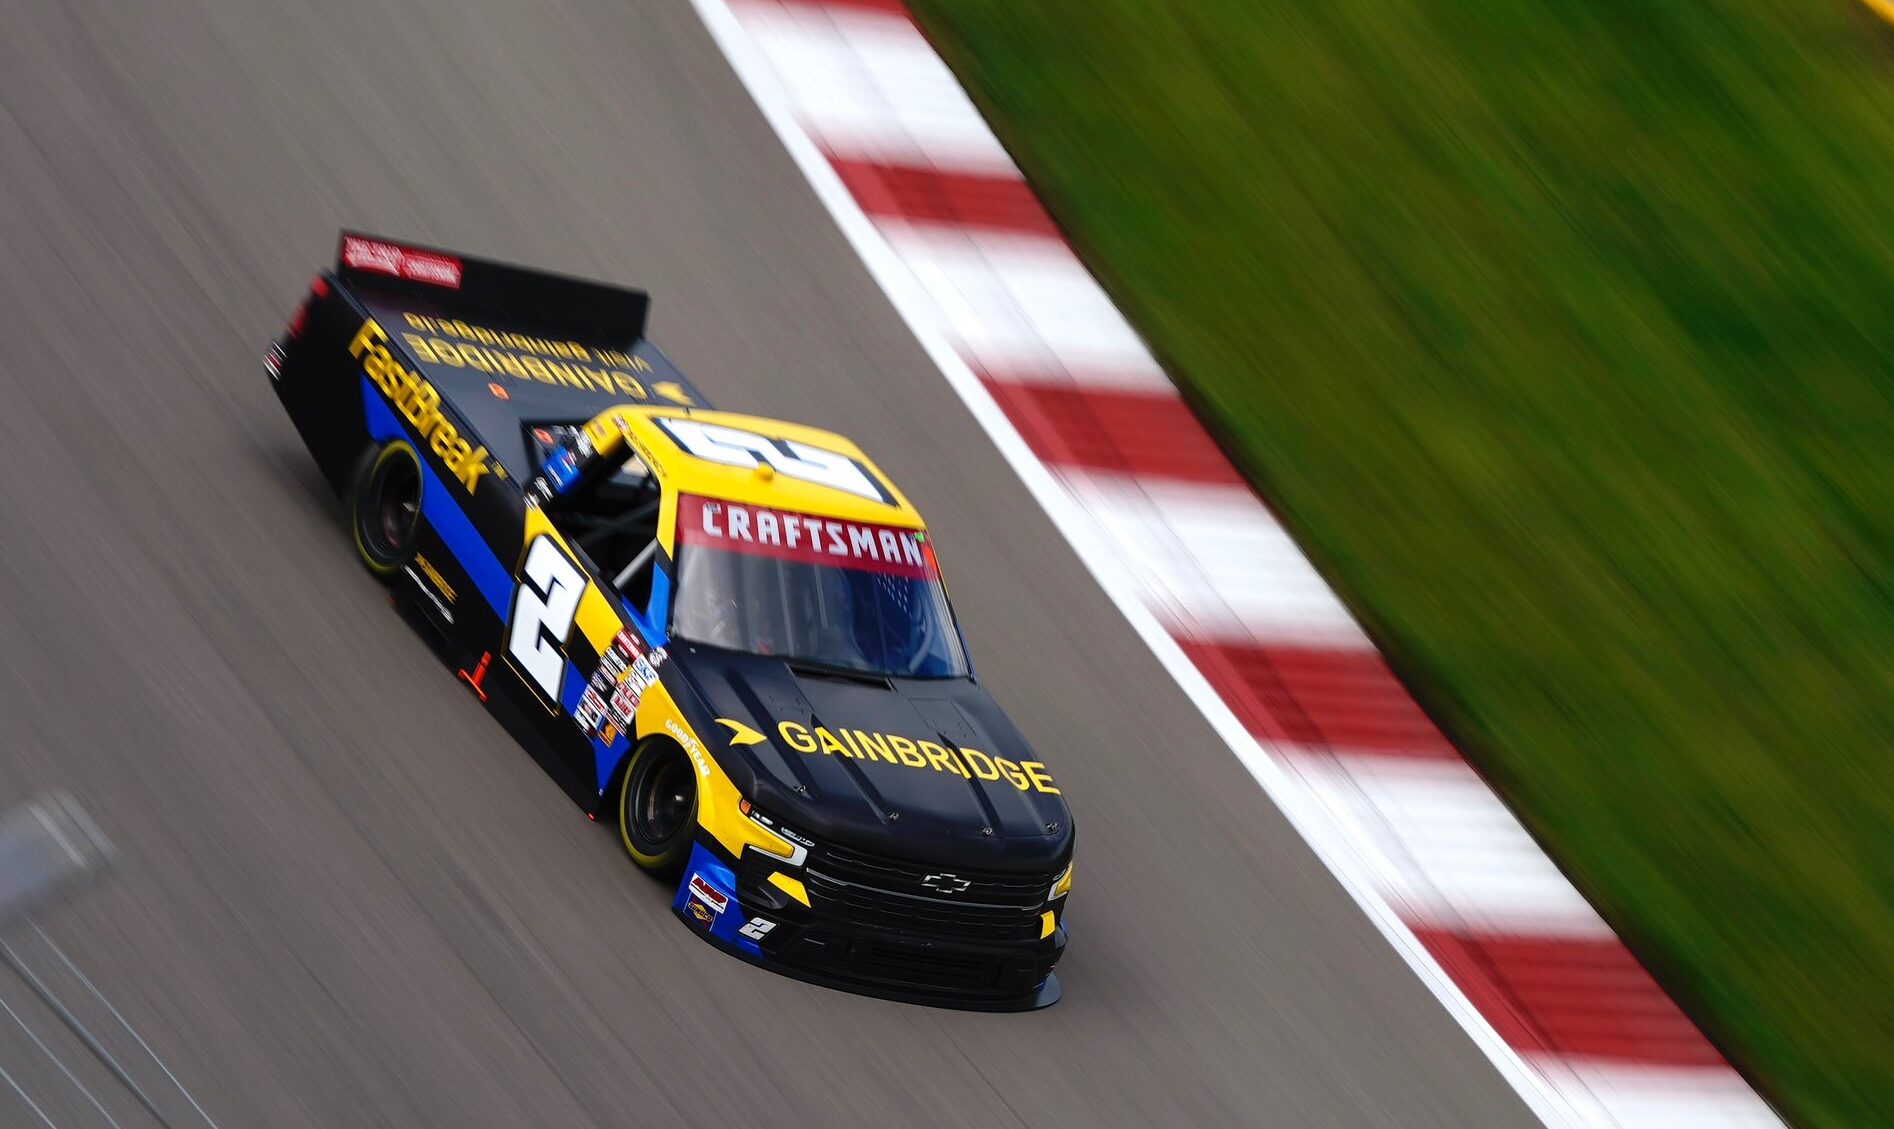
3rd in Points – Nick Sanchez
| Category | Statistic | 2024 Rank | ªRank Thru 12 Races |
| Avg. Fin.¹ | 7.0 | 1st of 30 | 6th of 264 |
| Best Fin. | 1st | — | — |
| Worst Fin. | 18th | — | — |
| Completed Laps%¹ | 99.95% | T1st of 30 | T3rd of 264 |
| Laps in Top15%¹ | 81.3% | 3rd of 30 | 38th of 264 |
| Avg. Driver Rating¹ | 101.08 | 3rd of 30 | 20th of 264‡ |
| Wins | 2 | T2nd of 69 | T10th of 724 |
| Poles | 2 | T2nd of 69 | T5th of 724 |
| Top 2’s | 3 | T2nd of 69 | T14th of 724 |
| Top 3’s | 5 | 2nd of 69 | T7th of 724 |
| Top 5’s | 7 | 2nd of 69 | T5th of 724 |
| Top 10’s | 9 | 3rd of 69 | T13th of 724 |
| Finish out Top 20¹ | 0 | T1st of 30 | T1st of 264 |
| DNF’s¹ | 0 | T1st of 30 | T1st of 264 |
| Stage Wins | 1 | T6th of 69 | T43rd of 642* |
| Stage T10s | 13 | T7th of 69 | T58th of 642* |
| Stage Pts | 85 | 5th of 69 | 43rd of 642* |
| Avg. Stage Fin.¹ | 10.04 | 5th of 30 | — |
| Playoff Pts² | 11 | 3rd of 69 | T12th of 642* |
ªSince Playoffs started in 2016
¹Ranks of drivers to start 43% of races thru 12 races
²Earned from races only, does not reflect penalties
*Stage racing started in 2017
‡Max Driver Rating is 150.0
- Notable Streaks this year
- 2 straight Top 3 finishes (active streak, longest active streak in Truck Series)
- 2 straight Top 5 finishes (active streak, longest active streak in Truck Series)
- 7 straight Top 10 finishes (active streak)
- 3 straight Stage T10’s (active streak)
- 4 straight Stage T10’s
- Notable Nashville Streaks
- 1 straight Pole (active “streak”)
- 1 straight Top 3 finish (active “streak”)
- 2024 Intermediate Stats (Avg. Fin. and Driver Rating rank among drivers with 1+ Intermediate start, 45 drivers)
- 5 Races, Avg. Finish 5.8(6th), 77.44% of Laps ran in Top15(9th), Avg. Driver Rating 98.0(6th), Best 1st, Worst 17th, Laps Completed 99.86%, Led 4.32% of laps he ran, 1 Win, 2 Poles, 3 Top 3’s, 3 Top 5’s, 4 Top 10’s, 4 Top 15’s, 0 Finishes out of Top 20, 0 DNF’s, 0 Stage Wins, 2.9 Stage Pts Per Stage, Avg. Stage Finish 10.3
- Nashville Statistics
- 2023 Nashville Race
- Finished 3rd, Started 1st, Led 37 laps(24.67%), Finished 2nd in Stage 1, ran 150 Laps in Top 15(100% of laps ran), had 114.0 Driver Rating (ranked 4th)
- Notable Nashville Statistics over last 5 years (Ranks are of drivers with 1+ start this year and 1+ start at Nashville since 2019, 35 drivers)
- 1 Race
- 3.0 Avg. Finish (Ranks 2nd)
- Best Finish: 3rd, Worst: 3rd
- Completed 100% of laps (% ranks T1st)
- 100% of Laps ran in Top15 (% ranks T1st)
- 114.0 Average Driver Rating (Ranks 2nd)
- Led 24.67% of laps he’s run (ranks 1st)
- 1 Pole, 100% (% ranks 1st)
- 1 Top 3, 100% (% ranks 1st)
- 0 finishes outside Top 20, 0.00% (% ranks T1st)
- 0 DNF’s, 0.00% (% ranks T1st)
- 0 Stage Wins
- 1 Stage T10, 50.0% (% ranks T7th)
- 4.5 Stage Pts Per Stage (Ranks 5th)
– Nick Sanchez is notable because of his career stats at Nashville (1 race)
– At Gateway Sanchez picked up 16 Stage Pts, ran all but 2 laps in the Top 15, led 10 laps, and finished 3rd
– In the Rank Thru 12 Races category above he is 15th or better in 11 of the 17 stats including his 7.0 Avg. Finish, 7 Top 5’s, and 0 Finishes out of the Top 20
– He is actively on a 2 race Top 3 finish streak and a 7 race Top 10 streak, but his longest Stage T10 streak this year is only 4 straight stages
– At Nashville he is on an active 1 straight Pole streak and a 1 straight Top 3 finish streak
– In the 5 Intermediate races this year he’s ran just 77% of his laps in the Top 15 and has a 10.3 Avg. Stage Finish, but he does has 3 Top 5’s and a 5.8 Avg. Finish
– Sanchez won the Pole last year at Nashville, then he went on to run every lap in the Top 15, lead 25% of the race, and finish 3rd
– This is his only race at Nashville and thus the only stats to add are that he had a 114.0 Avg. Driver Rating and he got just 1 Stage T10
Outlook for this weekend
The Sophomore slump hasn’t found it’s way to Nick Sanchez yet as his 2024 stats are great all around, but he has shown a vulnerability in stages. The same can be said for him at Intermediates as his stage stats aren’t too impressive, but his finish stats are pretty good with him getting 3 Top 5’s in 5 races. What could be better? Well, this is Nashville where he won the Pole in his only start and led 25% of the race en route to a good finish, but again he wasn’t great in stages. The stats are clear, don’t look for Sanchez to do well in stages this weekend, but keep an eye on him in the final stage as he probably finishes up front.
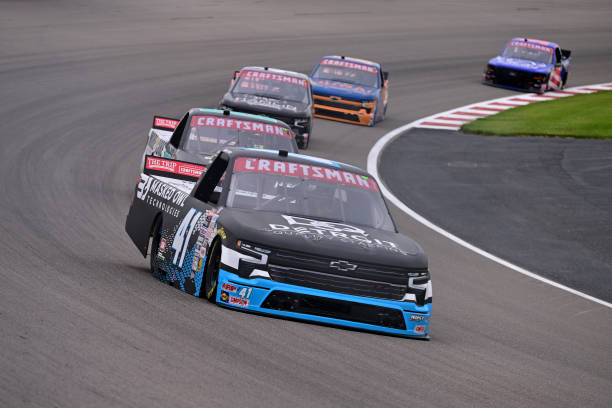
18th in Points – Bayley Currey
| Category | Statistic | 2024 Rank | ªRank Thru 12 Races |
| Avg. Fin.¹ | 19.67 | 19th of 30 | T61st of 264 |
| Best Fin. | 11th | — | — |
| Worst Fin. | 30th | — | — |
| Completed Laps%¹ | 97.15% | T14th of 30 | T80th of 264 |
| Laps in Top15%¹ | 32.94% | 20th of 30 | 158th of 264 |
| Avg. Driver Rating¹ | 62.46 | 19th of 30 | 156th of 264‡ |
| Wins | 0 | T7th of 69 | T67th of 724 |
| Poles | 0 | T9th of 69 | T58th of 724 |
| Top 2’s | 0 | T13th of 69 | T116th of 724 |
| Top 3’s | 0 | T16th of 69 | T145th of 724 |
| Top 5’s | 0 | T26th of 69 | T199th of 724 |
| Top 10’s | 0 | T39th of 69 | T305th of 724 |
| Finish out Top 20¹ | 5 | 18th of 30 | T166th of 264 |
| DNF’s¹ | 1 | T7th of 30 | T46th of 264 |
| Stage Wins | 0 | T11th of 69 | T87th of 642* |
| Stage T10s | 5 | T20th of 69 | T127th of 642* |
| Stage Pts | 14 | 20th of 69 | T131st of 642* |
| Avg. Stage Fin.¹ | 17.79 | 17th of 30 | — |
| Playoff Pts² | 0 | T10th of 69 | T76th of 642* |
ªSince Playoffs started in 2016
¹Ranks of drivers to start 43% of races thru 12 races
²Earned from races only, does not reflect penalties
*Stage racing started in 2017
‡Max Driver Rating is 150.0
- Notable Streaks this year
- 2 straight Stage T10’s
- Notable Nashville Streaks
- 1 straight Top 5 finish (active “streak”)
- 2 straight Stage T10’s (active streak)
- 2024 Intermediate Stats (Avg. Fin. and Driver Rating rank among drivers with 1+ Intermediate start, 45 drivers)
- 5 Races, Avg. Finish 20.2(32nd), 34.55% of Laps ran in Top15(30th), Avg. Driver Rating 58.32(28th), Best 11th, Worst 28th, Laps Completed 99.03%, Led 0.00% of laps he ran, 0 Wins, 0 Poles, 0 Top 3’s, 0 Top 5’s, 0 Top 10’s, 2 Top 15’s, 3 Finishes out of Top 20, 0 DNF’s, 0 Stage Wins, 0.1 Stage Pts Per Stage, Avg. Stage Finish 19.5
- Nashville Statistics
- 2023 Nashville Race
- Finished 5th, Started 2nd, Led 1 lap(0.67%), Finished 3rd in Stage 1 and 7th in Stage 2, ran 150 Laps in Top 15(100% of laps ran), had 109.5 Driver Rating (ranked 5th)
- Notable Nashville Statistics over last 5 years (Ranks are of drivers with 1+ start this year and 1+ start at Nashville since 2019, 35 drivers)
- 1 Race
- 5.0 Avg. Finish (Ranks 3rd)
- Best Finish: 5th, Worst: 5th
- Completed 100% of laps (% ranks T1st)
- 100% of Laps ran in Top15 (% ranks T1st)
- 109.5 Average Driver Rating (Ranks 3rd)
- Led 0.67% of laps he’s run (% ranks 8th)
- 0 Top 3’s
- 1 Top 5, 100% (% ranks T1st)
- 0 finishes outside Top 20, 0.00% (% ranks T1st)
- 0 DNF’s, 0.00% (% ranks T1st)
- 0 Stage Wins
- 2 Stage T10’s, 100% (% ranks T1st)
- 6.0 Stage Pts Per Stage (Ranks 3rd)
– Bayley Currey is notable because of how he did in last years Nashville race
– At Gateway Currey had mechanical issues near the end the of the race that caused him to finish 29th, but still he only ran 2 laps in the Top 15 all day
– Thru 12 races this year he has 0 Top 10’s to 5 finishes out of the Top 20, and he only has 5 Stage T10’s as well with just a 17.79 Avg. Stage Finish
– The only streak he has this year is a 2 straight Stage T10 streak
– At Nashville he is on a 1 race Top 5 “streak” and a 2 straight Stage T10 streak
– In the 5 Intermediate races this year he has his best finish of the year, 11th, but he’s only ran 35% of his laps in the Top 15 and has 3 finishes out of the Top 20
– In the 2023 Nashville race Currey ran all 150 laps in the Top 15, got 12 Stage Pts, and even led 1 lap en route to an impressive 5th place finish with the 5th best Driver Rating
– This is his only Nashville Truck race and thus the only thing to add is that he had a 109.5 Driver Rating in last years race
Outlook for this weekend
Bayley Currey has struggled in his first full-time Truck season as he’s not even scored a Top 10 in the first 12 races of the season, and he’s not ran particularly well either. Some slightly good news is that this week is an Intermediate where he got his best finish of the year, but overall he’s not run or finished well in the 5 Intermediate races. However, there is finally good news. This week is Nashville where Currey ran great last year and was able to finish Top 5. In all, don’t expect too much from Currey this weekend, but with this being Nashville it could be his best run of the season so far.
22nd in Points/7th in Owner Points – Kaden Honeycutt
| Category | Statistic | 2024 Rank | ªRank Thru 12 Races |
| Avg. Fin.¹ | 7.6 | — | — |
| Best Fin. | 4th | — | — |
| Worst Fin. | 12th | — | — |
| Completed Laps%¹ | 100% | — | — |
| Laps in Top15%¹ | 81.24% | — | — |
| Avg. Driver Rating¹ | 96.8 | — | –‡ |
| Wins | 0 | T7th of 69 | T67th of 724 |
| Poles | 0 | T9th of 69 | T58th of 724 |
| Top 2’s | 0 | T13th of 69 | T116th of 724 |
| Top 3’s | 0 | T16th of 69 | T145th of 724 |
| Top 5’s | 1 | T14th of 69 | T123rd of 724 |
| Top 10’s | 4 | T8th of 69 | T100th of 724 |
| Finish out Top 20¹ | 0 | — | — |
| DNF’s¹ | 0 | — | — |
| Stage Wins | 1 | T6th of 69 | T43rd of 642* |
| Stage T10s | 7 | T14thof 69 | T104th of 642* |
| Stage Pts | 41 | T12th of 69 | T86th of 642* |
| Avg. Stage Fin.¹ | 7.7 | — | — |
| Playoff Pts² | 1 | T7th of 69 | T54th of 642* |
ªSince Playoffs started in 2016
¹Ranks of drivers to start 43% of races thru 12 races
²Earned from races only, does not reflect penalties
*Stage racing started in 2017
‡Max Driver Rating is 150.0
- Notable Streaks this year
- 3 straight Top 10 finishes (active streak of races he’s run)
- 2 straight Stage T10’s
- 6 straight Stage T10’s (active streak of races he’s run)
- Notable Nashville Streaks
- none
- 2024 Intermediate Stats (Avg. Fin. and Driver Rating rank among drivers with 1+ Intermediate start, 45 drivers)
- 2 Races, Avg. Finish 5.5(5th), 91.42% of Laps ran in Top15(5th), Avg. Driver Rating 112.3(3rd), Best 4th, Worst 7th, Laps Completed 100%, Led 0.37% of laps he ran, 0 Wins, 0 Poles, 0 Top 3’s, 1 Top 5, 2 Top 10’s, 2 Top 15’s, 0 Finishes out of Top 20, 0 DNF’s, 1 Stage Win, 7.75 Stage Pts Per Stage, Avg. Stage Finish 3.25
- Nashville Statistics
- 2023 Nashville Race
- did not race
- Notable Nashville Statistics over last 5 years (Ranks are of drivers with 1+ start this year and 1+ start at Nashville since 2019, 35 drivers)
- 1 Race
- 21.0 Avg. Finish (Ranks 19th)
- Best Finish: 21st, Worst: 21st
- Completed 100% of laps (% ranks T1st)
- 0.00% of Laps ran in Top15 (% ranks T30th)
- 43.5 Average Driver Rating (Ranks 29th)
- Led 0.00% of laps he’s run
- 0 Top 15’s
- 1 finish outside Top 20, 100% (% ranks T24th)
- 0 DNF’s, 0.00% (% ranks T1st)
- 0 Stage Wins
- 0 Stage T10’s
– Kaden Honeycutt is notable because of his stats on Intermediate tracks this year
– The last truck race Honeycutt ran was Charlotte where he won Stage 1, ran 87% of his laps in the Top 15, and finished 7th
– He has finished 4 of his 5 races this year in the Top 10 while also finishing 7 of his 10 stages in the T10 as well en route to a 7.6 Avg. Race Finish and a 7.7 Avg. Stage Finish
– In races he’s ran this year he is on a 3 race Top 10 streak and a 6 straight Stage T10 streak
– He has no streaks here at Nashville in the Truck Series
– 2 of his races this year have been on Intermediate tracks where he’s finished 4th and 7th while running 91% of his laps in the Top 15 and getting 1 Stage Win
– Honeycutt did not compete in the 2023 Nashville Truck race
– He’s ran just 1 Truck race at Nashville and in the race he ran 0 laps in the Top 15 en route to a 21st place finish
Outlook for this weekend
Kaden Honeycutt has only ran 5 races this year, but he’s been mighty impressive. In fact, he has more Top 10’s than full-time drivers Stewart Friesen, Chase Purdy, and Layne Riggs. Even better is that 2 of his 5 races have been at Intermediate tracks where he’s ran extremely well and has gotten his only Top 5 finish this year. However, this is Nashville where he ran 1 race and ran pretty bad, but he was with a well underfunded team. Overall, based on how he’s ran this year expect Honeycutt to be Top 10 most the race this weekend and expect him to finish there as well.


