
In this post you will only find all-time stats for the All-Star Race, if you are looking for all-time stats at North Wilkesboro check out my previous article All-Time Cup Track Stats: North Wilkesboro, or if you are looking for only active drivers stats or Next Gen stats check out my next article Active/Next Gen Cup Stats: All-Star Race.
Active means any driver who started a race in the 2025 Cup Series season.
First Winner: Darrell Waltrip 05/25/1985
Most Recent Winner: Kyle Larson 05/19/2024
| Rank | Year | Start Pos. | Driver | Rank | Year | Start Pos. | Driver |
| 1 | 2002 | 27 | Ryan Newman | T7 | 2003 | 16 | Jimmie Johnson |
| 2 | 2008 | 24 | Kasey Kahne | T7 | 2023 | 16 | Kyle Larson |
| 3 | 1996 | 20 | Michael Waltrip | 9 | 2009 | 15 | Tony Stewart |
| 4 | 1997 | 19 | Jeff Gordon | T10 | 1999 | 13 | Terry Labonte |
| T5 | 2013 | 18 | Jimmie Johnson | T10 | 2020 | 13 | Chase Elliott |
| T5 | 2019 | 18 | Kyle Larson |

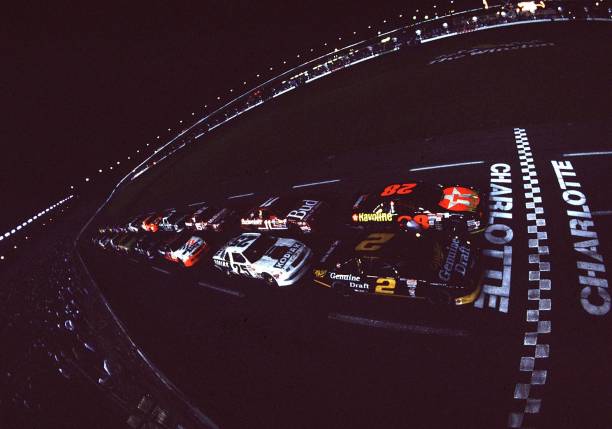
There has only been one All-Star Race in which 27 drivers started the race, in that race Ryan Newman started last and won which means his record above is pretty safe. Photo by ISC Archives — CQ-Roll Call Group via Getty Images
| Rank | Year | Finish | Driver | Rank | Year | Finish | Driver |
| 1 | 2008 | 24 | Kyle Busch | T7 | 2001 | 15 | Rusty Wallace |
| 2 | 2022 | 21 | Kyle Busch | T8 | 1987 | 14 | Bill Elliott |
| 3 | 1994 | 19 | Rusty Wallace | T8 | 1989 | 14 | Terry Labonte |
| 4 | 2003 | 16 | Bill Elliott | T8 | 2006 | 14 | Kasey Kahne |
| T5 | 1995 | 15 | Bobby Labonte | T8 | 2018 | 14 | Matt Kenseth |
| T5 | 1999 | 15 | Bobby Labonte |
– Kyle Busch better hope he doesn’t start 1st in the All-Star Race this weekend as 2 of the 4 times he’s done so he’s finished out of the Top 20.
| Year | Driver | Year | Driver |
| 1990 | Dale Earnhardt | 2015 | Denny Hamlin |
| 1991 | Davey Allison | 2021 | Kyle Larson |
| 1992 | Davey Allison | 2024 | Joey Logano |
| 2010 | Kurt Busch |
– Only 7 out of 40 All-Star Races have seen the driver that started 1st also finish 1st in the race, but 2 of those have come in the last 4 races.
| Best Laps Led% by Winner | Worst Laps Led% by Winner | ||||||
| Rank | Year | Laps Led% | Driver | Rank | Year | Laps Led% | Driver |
| T1 | 1990 | 100 | Dale Earnhardt | 1 | 2009 | 2.00 | Tony Stewart |
| T1 | 1991 | 100 | Davey Allison | T2 | 1993 | 2.86 | Dale Earnhardt |
| 3 | 2024 | 99.50 | Joey Logano | T2 | 2000 | 2.86 | Dale Earnhardt Jr. |
| 4 | 1986 | 98.80 | Bill Elliott | 4 | 2004 | 5.56 | Matt Kenseth |
| 5 | 2023 | 72.50 | Kyle Larson | 5 | 1988 | 6.67 | Terry Labonte |
| 6 | 1995 | 70.00 | Jeff Gordon | 6 | 1987 | 7.41 | Dale Earnhardt |
| 7 | 2022 | 60.00 | Ryan Blaney | 7 | 2016 | 10.62 | Joey Logano |
| T8 | 1989 | 51.11 | Rusty Wallace | 8 | 2013 | 11.11 | Jimmie Johnson |
| T8 | 1992 | 44.29 | Davey Allison | T9 | 1996 | 12.86 | Michael Waltrip |
| 10 | 1998 | 44.29 | Mark Martin | T9 | 1997 | 12.86 | Jeff Gordon |
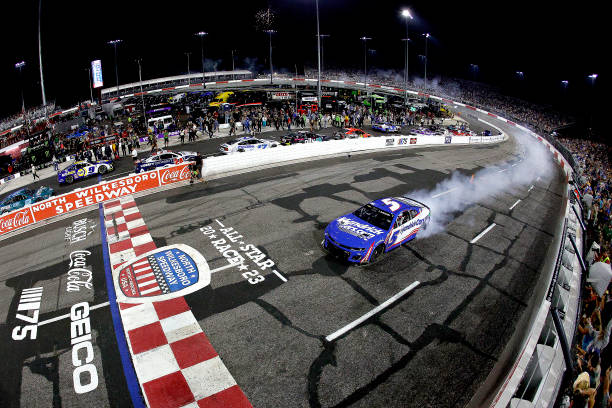
– 4 of the last 5 All-Star Races have seen a driver lead over 40% of the race and win, including both North Wilkesboro All-Star races. So, don’t be surprised if someone dominates the race and wins this weekend.
| Rank | Race | Laps Led% | Driver | Fin. | Rank | Race | Laps Led% | Driver | Fin. |
| T1 | 1990 | 100 | Dale Earnhardt | 1st | 6 | 2023 | 70.00 | Kyle Larson | 1st |
| T1 | 1991 | 100 | Davey Allison | 1st | 7 | 1995 | 60.00 | Jeff Gordon | 1st |
| 3 | 2024 | 98.80 | Joey Logano | 1st | 8 | 2022 | 57.14 | Ryan Blaney | 1st |
| 4 | 1986 | 89.63 | Bill Elliott | 1st | 9 | 2017 | 56.00 | Kyle Larson | 2nd |
| 5 | 1987 | 72.50 | Bill Elliott | 14th | 10 | 2010 | 54.44 | Jimmie Johnson | 13th |
– 8 of the 11 times that a driver has led over 54% of the laps in the All-Star Race they have also went on to Win the race.
| Most Lead Lap cars at finish of race | Fewest Lead Lap cars at finish of race | ||||
| Rank | Year | # of cars | Rank | Year | # of cars |
| 1 | 2008 | 22 | T1 | 1986 | 7 |
| T2 | 2012 | 21 | T1 | 1988 | 7 |
| T2 | 2021 | 21 | 3 | 2017 | 9 |
| T4 | 2001 | 20 | T4 | 1995 | 10 |
| T4 | 2013 | 20 | T4 | 2002 | 10 |
| T4 | 2020 | 20 | T4 | 2005 | 10 |
| 7 | 2015 | 19 | T4 | 2006 | 10 |
| T8 | 1996 | 18 | T8 | 1985 | 11 |
| T8 | 2022 | 18 | T8 | 1987 | 11 |
| T10 | 1997 | 17 | T8 | 1999 | 11 |
| T10 | 2009 | 17 | T8 | 2000 | 11 |
| T10 | 2011 | 17 | |||
| T10 | 2024 | 17 | |||
– Unless almost every driver in the All-Star Race finishes on the lead lap this weekend then 2008 will still hold the top spot to itself in the most lead lap finishes table above.
| Best Avg. Fin. by Starting Position (1-23) |
Worst Avg. Fin. by Starting Position (1-23) |
||||
| Rank | Start Pos. | Avg. Fin | Rank | Start Pos. | Avg. Fin |
| 1 | 2nd | 7.63 | 1 | 22nd | 15.80 |
| 2 | 5th | 8.27 | 2 | 19th | 12.68 |
| 3 | 1st | 8.68 | 3 | 15th | 12.55 |
| 4 | 3rd | 9.40 | 4 | 16th | 12.45 |
| 5 | 4th | 9.52 | 5 | 14th | 12.32 |
| 6 | 7th | 10.53 | 6 | 23rd | 12.29 |
| 7 | 10th | 10.58 | T7 | 18th | 11.97 |
| 8 | 20th | 10.78 | T7 | 12th | 11.97 |
| 9 | 11th | 11.10 | 9 | 6th | 11.85 |
| 10 | 9th | 11.13 | 10 | 21st | 11.83 |
– There is a 3.12 Avg. Finish difference between worst and 2nd to worst in the table above, but there is only a 5.05 Avg. Finish difference between best and 2nd to worst.
| Best All-Star Avg. Fin. All-time |
Best All-Star Laps Led% All-time |
||||||
| Rank | Driver | Avg. Fin. | Starts | Rank | Driver | Laps Led% | Starts |
| 1 | Tim Richmond | 4.00 | 2 | 1 | Rick Mast | 30.00 | 1 |
| 2 | Jerry Nadeau | 4.50 | 2 | 2 | Kyle Larson | 23.80 | 8 |
| T3 | Dick Trickle | 6.00 | 1 | 3 | Robert Pressley | 22.86 | 1 |
| T3 | Johnny Sauter | 6.00 | 1 | 4 | Davey Allison | 18.69 | 7 |
| 5 | Joey Logano | 6.07 | 14 | 5 | Bill Elliott | 17.71 | 18 |
| 6 | Ken Schrader | 6.13 | 8 | 6 | Ryan Blaney | 16.68 | 8 |
| 7 | Davey Allison | 6.14 | 7 | 7 | Kyle Busch | 15.47 | 19 |
| 8 | Bobby Allison | 6.33 | 3 | 8 | Joey Logano | 14.08 | 14 |
| T9 | Kyle Larson | 7.00 | 8 | 9 | Jimmie Johnson | 13.07 | 19 |
| T9 | Robert Pressley | 7.00 | 1 | 10 | Dale Earnhardt | 10.39 | 16 |
If Kyle Larson can lead 138 laps or more this weekend then he will be atop the Laps Led% table above. Photo by Sean Gardner — Getty Images
| Most All-Star Race Starts All-time |
Best All-Star Race Laps Completed% |
|||||
| Rank | Driver | Starts | Rank | Driver | Lap Comp% | Starts |
| 1 | Mark Martin | 24 | T1 | Aric Almirola | 100 | 5 |
| 2 | Kevin Harvick | 23 | T1 | Brian Vickers | 100 | 4 |
| 3 | Jeff Gordon | 22 | T1 | Bubba Wallace | 100 | 4 |
| 4 | Kurt Busch | 21 | T1 | Christopher Bell | 100 | 4 |
| T5 | Ryan Newman | 20 | T1 | David Ragan | 100 | 4 |
| T5 | Terry Labonte | 20 | T1 | Bobby Allison | 100 | 3 |
| T7 | Jimmie Johnson | 19 | T1 | Jimmy Spencer | 100 | 3 |
| T7 | Kyle Busch | 19 | T1 | Michael McDowell | 100 | 3 |
| T7 | Matt Kenseth | 19 | T1 | Tyler Reddick | 100 | 3 |
| T7 | Rusty Wallace | 19 | T1 | 11 drivers tied with same number of starts | 100 | 2 |
– If Christopher Bell (and Bubba Wallace if he makes the All-Star Race) can run every lap in the race then he (they) will join Aric Almirola as the only drivers to compete in 5+ All-Star Races and complete every lap.
| Most All-Star Race Wins All-time |
Best All-Star Race Win% All-time |
|||||
| Rank | Driver | Wins | Rank | Driver | Win% | Wins |
| 1 | Jimmie Johnson | 4 | 1 | Kyle Larson | 37.50 | 3 |
| T2 | Kyle Larson | 3 | 2 | Davey Allison | 28.57 | 2 |
| T2 | Dale Earnhardt | 3 | 3 | Jimmie Johnson | 21.05 | 4 |
| T2 | Jeff Gordon | 3 | 4 | Dale Earnhardt | 18.75 | 3 |
| T5 | Davey Allison | 2 | 5 | Joey Loganno | 14.29 | 1 |
| T5 | Joey Logano | 2 | 6 | Jeff Gordon | 13.64 | 3 |
| T5 | Terry Labonte | 2 | 7 | Ryan Blaney | 12.50 | 1 |
| T5 | Kevin Harvick | 2 | 8 | Chase Elliott | 11.11 | 2 |
| T5 | Mark Martin | 2 | 9 | Terry Labonte | 10.00 | 1 |
| T10 | 17 drivers tied | 1 | 10 | Carl Edwards | 9.09 | 2 |
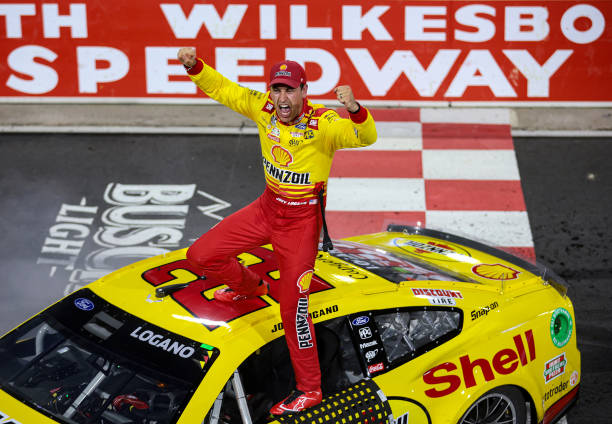
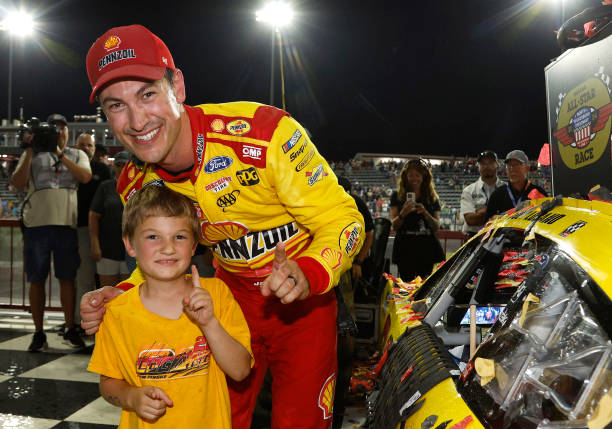
With his All-Star win last year Joey Logano became just the 9th driver to win multiple All-Star Races, and the 10th driver to get 5+ Top 3 All-Star finishes. Photo by James Gilbert — Getty Images
| Most All-Star Race Top 3’s All-time |
Best All-Star Race Top 3% All-time |
|||||
| Rank | Driver | Top 3’s | Rank | Driver | Top3% | Top3’s |
| T1 | Dale Earnhardt | 7 | 1 | Ken Schrader | 62.50 | 5 |
| T1 | Kevin Harvick | 7 | T2 | Kyle Larson | 50.00 | 4 |
| T3 | Jimmie Johnson | 6 | T2 | Austin Cindric | 50.00 | 1 |
| T3 | Matt Kenseth | 6 | T2 | David Reutimann | 50.00 | 1 |
| T5 | Ken Schrader | 5 | T2 | Tim Richmond | 50.00 | 1 |
| T5 | Joey Logano | 5 | 6 | Dale Earnhardt | 43.75 | 7 |
| T5 | Kyle Busch | 5 | 7 | Davey Allison | 42.86 | 3 |
| T5 | Terry Labonte | 5 | 8 | Joey Logano | 35.71 | 5 |
| T5 | Jeff Gordon | 5 | 9 | Tyler Reddick | 33.33 | 1 |
| T5 | Mark Martin | 5 | T10 | Jimmie Johnson | 31.58 | 6 |
| T10 | Matt Kenseth | 31.58 | 6 | |||
– Ken Schrader was great at finishing well in the All-Star Race as he has the best Top 3% above and the 3rd best Top 5% below, but he couldn’t find a way to win in his 8 starts.
| Most All-Star Race Top 5’s All-time |
Best All-Star Race Top 5% All-time |
|||||
| Rank | Driver | Top 5’s | Rank | Driver | Top5% | Top5’s |
| T1 | Dale Earnhardt | 9 | T1 | Jerry Nadeau | 100 | 2 |
| T1 | Jimmie Johnson | 9 | T1 | Tim Richmond | 100 | 2 |
| T3 | Joey Logano | 8 | 3 | Ken Schrader | 75.00 | 6 |
| T3 | Tony Stewart | 8 | 4 | Kyle Larson | 62.50 | 5 |
| T3 | Kurt Busch | 8 | T5 | Joey Logano | 57.14 | 8 |
| T6 | Denny Hamlin | 7 | T5 | Davey Allison | 57.14 | 4 |
| T6 | Matt Kenseth | 7 | 7 | Dale Earnhardt | 56.25 | 9 |
| T6 | Jeff Gordon | 7 | T8 | Bubba Wallace | 50.00 | 2 |
| T6 | Kevin Harvick | 7 | T8 | Cale Yarborough | 50.00 | 2 |
| T10 | 6 drivers tied | 6 | T8 | Austin Cindric | 50.00 | 1 |
| T8 | Chase Briscoe | 50.00 | 1 | |||
| T8 | David Reutimann | 50.00 | 1 | |||
| Most All-Star Race Top 10’s All-time |
Best All-Star Race Top 10% All-time |
|||||
| Rank | Driver | Top 10’s | Rank | Driver | Top10% | Top10’s |
| 1 | Dale Earnhardt Jr. | 14 | T1 | Bobby Allison | 100 | 3 |
| T2 | Joey Logano | 13 | T1 | Benny Parsons | 100 | 2 |
| T2 | Bill Elliott | 13 | T1 | Jerry Nadeau | 100 | 2 |
| T2 | Kevin Harvick | 13 | T1 | Tim Richmond | 100 | 2 |
| T5 | Dale Earnhardt | 12 | T1 | Dick Trickle | 100 | 1 |
| T5 | Denny Hamlin | 12 | T1 | Johnny Sauter | 100 | 1 |
| T5 | Kyle Busch | 12 | T1 | Rich Bickle | 100 | 1 |
| T5 | Matt Kenseth | 12 | T1 | Robert Pressley | 100 | 1 |
| T9 | Jimmie Johnson | 11 | T1 | Scott Riggs | 100 | 1 |
| T9 | Kurt Busch | 11 | T1 | Joey Logano | 92.86 | 13 |
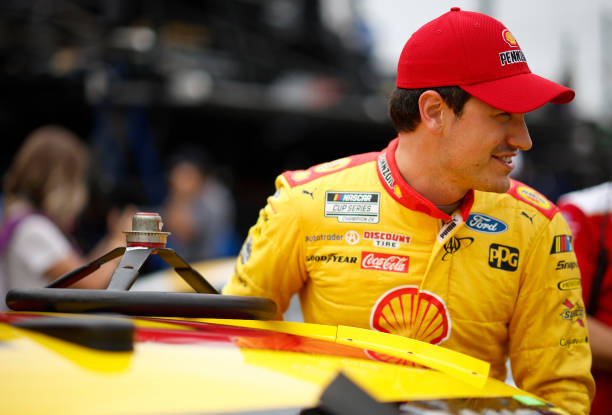
Joey Logano is the All-Star Race master as he is the only driver with 4+ starts to finish 90% or more of his All-Star Races in the Top 10, and he’s actually only finished out of the Top 10 once in 14 All-Star Races. Photo by Jared C. Tilton — Getty Images
| Most All-Star Race Starts without Win |
Longest All-Star Race Win Streak All-time |
|||||
| Rank | Driver | Starts | Rank | Driver | Streak | Year |
| T1 | Bobby Labonte | 17 | T1 | Davey Allison | 2 | 1991-92 |
| T1 | Dale Jarrett | 17 | T1 | Jimmie Johnson | 2 | 2012-13 |
| T1 | Ricky Rudd | 17 | T3 | 36
drivers tied |
1 | 1985-2024 |
| 4 | Brad Keselowski | 16 | ||||
| 5 | Martin Truex Jr. | 14 | ||||
| T6 | Greg Biffle | 13 | ||||
| T6 | Sterling Marlin | 13 | ||||
| 8 | Jeff Burton | 12 | ||||
| T9 | Clint Bowyer | 11 | ||||
| T9 | Kyle Petty | 11 | ||||
– This weekend Joey Logano can become only the 3rd driver to win back-to-back All-Star races in the 41 year history of the race.
| Most All-Star Race Starts without Top 3 |
Longest All-Star Race Top 3 Streak All-time |
|||||
| Rank | Driver | Starts | Rank | Driver | Streak | Year |
| 1 | Jeff Burton | 12 | 1 | Ken Schrader | 4 | 1989-92 |
| 2 | Clint Bowyer | 11 | 2 | Kevin Harvick | 3 | 2018-20 |
| T3 | Morgan Shepherd | 8 | T3 | 16 drivers tied | 2 | 1985-2021 |
| T3 | Ward Burton | 8 | ||||
| T5 | A.J. Allmendinger | 7 | ||||
| T5 | Jeremy Mayfield | 7 | ||||
| T7 | Joe Nemechek | 6 | ||||
| T7 | Lake Speed | 6 | ||||
| T7 | Ricky Stenhouse Jr. | 6 | ||||
| T7 | William Byron | 6 | ||||
Ken Schrader (#25) may not have been able to win an All-Star Race, but he is the leader in longest Top 3 streak above and longest Top 5 streak below. Photo by ISC Archives — CQ-Roll Call Group via Getty Images
| Most All-Star Race Starts without Top 5 |
Longest All-Star Race Top 5 Streak All-time |
|||||
| Rank | Driver | Starts | Rank | Driver | Streak | Year |
| 1 | Clint Bowyer | 11 | 1 | Ken Schrader | 6 | 1989-94 |
| T2 | Morgan Shepherd | 8 | T2 | Bill Elliott | 5 | 1988-92 |
| T2 | Ward Burton | 8 | T2 | Tony Stewart | 5 | 2007-11 |
| 4 | A.J. Allmendinger | 7 | 4 | Jimmie Johnson | 4 | 2005-08 |
| T5 | Lake Speed | 6 | T5 | Davey Allison | 3 | 1990-92 |
| T5 | Ricky Stenhouse Jr. | 6 | T5 | Geoff Bodine | 3 | 1993-95 |
| T5 | William Byron | 6 | T5 | Kyle Busch | 3 | 2011-13 |
| T8 | Alex Bowman | 5 | T5 | Kurt Busch | 3 | 2015-17 |
| T8 | Aric Almirola | 5 | T5 | Kevin Harvick | 3 | 2018-20 |
| T8 | Bobby Hamilton | 5 | T10 | 33 drivers tied | 2 | 1985-2024 |
| T8 | Bobby Hillin Jr. | 5 | ||||
| T8 | Greg Sacks | 5 | ||||
| Most All-Star Race Starts without Top 10 |
Longest All-Star Race Top 10 Streak All-time |
|||||
| Rank | Driver | Starts | Rank | Driver | Streak | Year |
| 1 | Lake Speed | 6 | 1 | Joey Logano | 10 | 2015-24 |
| 2 | Ricky Stenhouse Jr. | 5 | 2 | Matt Kenseth | 9 | 2007-15 |
| T3 | Casey Mears | 3 | T3 | Dale Earnhardt | 7 | 1985-91 |
| T3 | Danica Patrick | 3 | T3 | Kyle Busch | 7 | 2015-21 |
| T3 | Phil Parsons | 3 | T5 | Ken Schrader | 6 | 1989-94 |
| T3 | Steve Park | 3 | T5 | Dale Earnhardt Jr. | 6 | 2004-09 |
| T7 | 8 drivers tied | 2 | T5 | Denny Hamlin | 6 | 2013-18 |
| T8 | Darrell Waltrip | 5 | 1985-89 | |||
| T8 | Bill Elliott | 5 | 1988-92 | |||
| T8 | Tony Stewart | 5 | 2007-11 | |||
| T8 | Dale Earnhardt Jr. | 5 | 2012-16 | |||
| T8 | Ryan Blaney | 5 | 2020-24 | |||
Joey Logano has been mentioned a lot in this article, and he will once more. Last year with his win he set the record for most consecutive All-Star Race Top 10’s and can extend it this year. Photo by Sean Gardner — Getty Images