
This article is a statistical summary of the race finish projections from the 2025 season. While the overall stats aren’t what I was hoping to achieve this year and were a little worse than last year, the Roval prediction was pretty darn good (as you’ll see below). So, with that said thank you for your support, enjoy these stats, and let’s start getting ready for the Daytona 500 projection next February.
Last weeks projected winner: William Byron
Finished: 33rd
Last weeks winner: Ryan Blaney
Projected Finish: 2nd
Additional notes from last race:
-1 driver finished where they were projected (Kyle Larson 3rd)
-10 of the 38 drivers finished within 2 spots (better or worse) of where they were projected
-16 of the 38 drivers finished within 5 spots (better or worse) of where they were projected
-13 of the 38 drivers finished 10+ spots (better or worse) than they were projected to finish
-10 of the projected Top 15 drivers finished inside the Top 15
Notes from all point race projections this year (36 races):
-Drivers to finish where they were projected: 64 of 1,369, 4.67%
-This was better than last years 4.42%
-Drivers to finish within 5 spots (better/worse) than they were projected: 546 of 1,369, 39.88%
-This was worse than last years 41.81%
-Drivers to finish 10+ spots (better/worse) than they were projected: 569 of 1,369, 41.56%
-This was worse than last years 39.90%
-Correct Winner projections: 6 of 36, 16.67%
-This was better than last years 5 winners correct (13.89%)
-Projected Top 10 finishers to finish Top 10: 169 of 360, 46.94%
-This was worse than last years 182 correct in Top 10 (50.56%)
Race Winners correctly predicted
-Denny Hamlin (Spring Martinsville), Kyle Larson (Spring Bristol & Spring Kansas), Shane Van Gisbergen (Mexico, Watkins Glen & Roval)
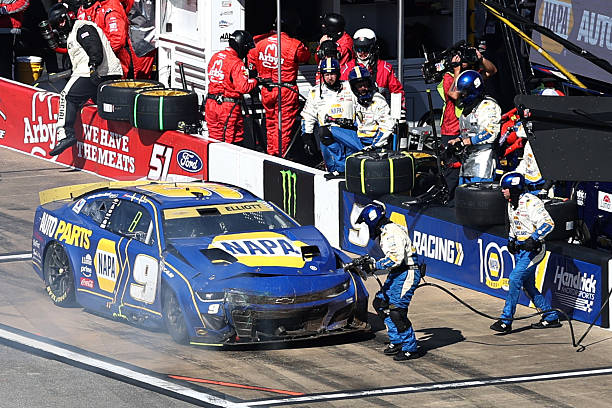
The projection for Chase Elliott in the Fall Talladega race was as bad as it can get as he was projected to win, but finished dead last. Photo by Jeff Robinson — Icon Sportswire via Getty Images
Worst Projected Race Winners finishing positions
-Chase Elliott (Fall Talladega 40th), Austin Cindric (Summer Atlanta 38th), Ryan Blaney (Spring Talladega 37th), Bubba Wallace (Daytona Night 37th), William Byron (Fall Las Vegas 36th, thanks Ty Dillon lol)
Projected Race Winner stats (correct/predicted)
-William Byron (0/7), Kyle Larson (2/5), Chase Elliott (0/4), Tyler Reddick (0/4), Shane Van Gisbergen (3/3), Ryan Blaney (0/3), Denny Hamlin (1/2), Austin Cindric (0/2), A.J. Allmendinger (0/1), Bubba Wallace (0/1), Joey Logano (0/1), Kyle Busch (0/1), Michael McDowell (0/1), Ty Gibbs (0/1)
Worst Projected finish by winner of a race
-Ross Chastain (Coke 600 28th), Josh Berry (Spring Las Vegas 20th), Chase Briscoe (Fall Talladega 20th), Chase Briscoe (Pocono 17th), William Byron (Daytona 500 13th)
Race with most drivers correctly projected
-Roval 6 drivers finished where they were projected (Shane Van Gisbergen 1st, Chris Buescher 4th, Ryan Blaney 13th, Chase Briscoe 14th, Ty Dillon 27th, Austin Dillon 31st)
Races with 0 drivers correctly projected
-Spring Atlanta, Spring Phoenix, Spring Talladega, Nashville, Summer Atlanta, Iowa, Bristol Night, New Hampshire, Fall Kansas, Fall Las Vegas, Fall Talladega
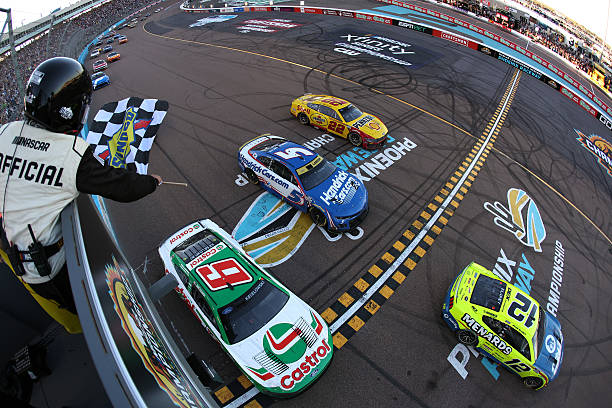
2025 Champ Kyle Larson had 5 races this year in which he finished where he was projected, including this 3rd place effort in the last race of the year. Photo by Meg Oliphant — Getty Images
Number of correct projection finishes by driver
-Kyle Larson (5), Chris Buescher (4), Shane Van Gisbergen (4), Tyler Reddick (4), Bubba Wallace (3), Denny Hamlin (3), Noah Gragson (3), Ryan Blaney (3), Austin Dillon (2), Brad Keselowski (2), Carson Hocevar (2), Chase Elliott (2), Cody Ware (2), Cole Custer (2), John Hunter Nemechek (2), Kyle Busch (2), Ty Dillon (2), Zane Smith (2), Alex Bowman (1), Chase Briscoe (1), Daniel Suarez (1), J.J. Yeley (1), Jesse Love (1), Joey Logano (1), Justin Haley (1), Katherine Legge (1), Michael McDowell (1), Ricky Stenhouse Jr. (1), Riley Herbst (1), Ross Chastain (1), Ryan Preece (1), Todd Gilliland (1), William Byron (1), A.J. Allmendinger (0), Austin Cindric (0), Christopher Bell (0), Erik Jones (0), Josh Berry (0),Ty Gibbs (0)
Number of correct projection finishes by position
-1st (6), 2nd (4), 3rd (6), 4th (2), 5th (3), 6th (3), 7th (1), 8th (0), 9th (0), 10th (1), 11th (1), 12th (2), 13th (3), 14th (3), 15th (0), 16th (1), 17th (1), 18th (1), 19th (0), 20th (4), 21st (0), 22nd (1), 23rd (2), 24th (0), 25th (4), 26th (1), 27th (2), 28th (1), 29th (0), 30th (2), 31st (2), 32nd (1), 33rd (2), 34th (1), 35th (0), 36th (1), 37th (1), 38th (1), 39th (0), 40th (0)
Races with most projected T10 finishers actually finishing in T10
-Roval (8), COTA (7), New Hampshire (7), Fall Kansas (7), 7 races tied at 6
Races with least projected T10 finishers actually finishing in T10
-Texas (1), Fall Talladega (2), 7 races tied at 3
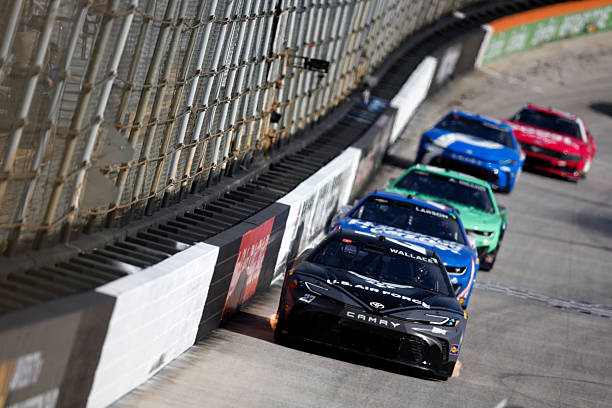
The Spring Bristol race saw 21 drivers finish within 5 spots of where they were projected, the most of any race this year. Photo by Sean Gardner — Getty Images
Races with most drivers finishing within 5 spots of projected finish
-Spring Bristol (21), Homestead (20), Michigan (20), Roval (20), Fall Martinsville (20)
Races with least drivers finishing within 5 spots of projected finish
-Texas (7), Coca-Cola 600 (8), Summer Atlanta (9), Fall Talladega (9), Fall Daytona (10)
Races with least drivers finishing 10+ spots of projected finish
-Pocono (9), Fall Martinsville (9), Sonoma (10), Iowa (10), 5 races tied at 11
Races with most drivers finishing 10+ spots of projected finish
-Texas (27), Coca-Cola 600 (27), Summer Atlanta (25), Chicago (25), Fall Daytona (23), Fall Talladega (23)