
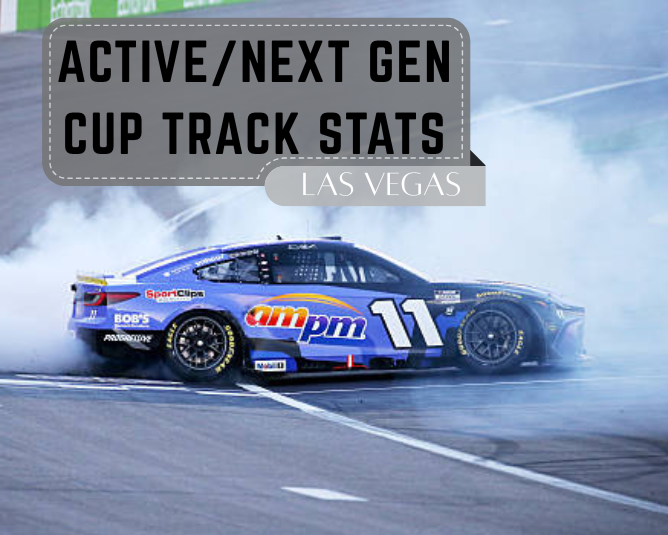
In this post you will only find active and Next Gen stats, if you are looking for all-time stats check out my previous article All-Time Cup Track Stats: Las Vegas.
| Finish | Start | Driver | Laps | Led | S1 Fin | S2 Fin | Driver Rating |
| 1 | 1 | Denny Hamlin | 267 | 9 | 4th | 4th | 121.2 |
| 2 | 6 | Kyle Larson | 267 | 129 | 2nd | 1st | 138.4 |
| 3 | 3 | Christopher Bell | 267 | 0 | 7th | 6th | 108.6 |
| 4 | 2 | Chase Briscoe | 267 | 57 | 3rd | 5th | 113.0 |
| 5 | 8 | Tyler Reddick | 267 | 1 | 8th | 2nd | 115.0 |
| 6 | 9 | Joey Logano | 267 | 1 | 10th | 9th | 94.5 |
| 7 | 12 | Alex Bowman | 267 | 0 | 15th | 8th | 95.4 |
| 8 | 32 | Kyle Busch | 267 | 0 | 25th | 17th | 72.2 |
| 9 | 16 | Ryan Preece | 267 | 0 | 14th | 31st | 84.9 |
| 10 | 34 | Brad Keselowski | 267 | 2 | 32rd | 12th | 78.8 |
| 11 | 31 | Austin Cindric | 267 | 0 | 28th | 29th | 60.0 |
| 12 | 11 | Chris Buescher | 267 | 0 | 11th | 13th | 84.6 |
| 13 | 28 | Noah Gragson | 267 | 0 | 19th | 15th | 73.3 |
| 14 | 24 | Ricky Stenhouse Jr. | 267 | 0 | 26th | 18th | 65.0 |
| 15 | 19 | Erik Jones | 267 | 0 | 21st | 20th | 63.0 |
| 16 | 18 | Michael McDowell | 267 | 0 | 27th | 24th | 58.8 |
| 17 | 33 | Riley Herbst | 267 | 0 | 30th | 23rd | 48.0 |
| 18 | 4 | Chase Elliott | 267 | 0 | 5th | 25th | 84.3 |
| 19 | 20 | A.J. Allmendinger | 267 | 0 | 17th | 21st | 67.8 |
| 20 | 17 | Daniel Suarez | 267 | 0 | 16th | 14th | 66.2 |
| 21 | 30 | Todd Gilliland | 267 | 1 | 32nd | 26th | 44.2 |
| 22 | 7 | Bubba Wallace | 267 | 5 | 6th | 27th | 85.9 |
| 23 | 15 | Ross Chastain | 267 | 0 | 35th | 22nd | 49.7 |
| 24 | 23 | Zane Smith | 267 | 0 | 18th | 19th | 53.2 |
| 25 | 25 | Austin Dillon | 267 | 0 | 22nd | 16th | 58.7 |
| 26 | 29 | Josh Berry | 266 | 0 | 24th | 30th | 40.8 |
| 27 | 27 | Justin Haley | 266 | 0 | 31st | 32nd | 37.2 |
| 28 | 21 | Cole Custer | 266 | 1 | 29th | 28th | 40.9 |
| 29 | 26 | John Hunter Nemechek | 265 | 0 | 20th | 33rd | 48.7 |
| 30 | 37 | J.J. Yeley | 263 | 0 | 36th | 36th | 32.0 |
| 31 | 38 | Katherine Legge | 261 | 0 | 37th | 37th | 27.7 |
| 32 | 22 | Carson Hocevar | 252 | 6 | 13th | 10th | 70.4 |
| 33 | 13 | Shane Van Gisbergen | 245 | 0 | 12th | 11th | 63.3 |
| 34 | 10 | Ty Gibbs | 244 | 0 | 9th | 7th | 81.6 |
| 35 | 36 | Cody Ware | 243 | 0 | 33rd | 35th | 28.8 |
| 36 | 5 | William Byron | 235 | 55 | 1st | 3rd | 99.9 |
| 37 | 35 | Ty Dillon | 233 | 0 | 34th | 34th | 27.7 |
| 38 | 14 | Ryan Blaney | 70 | 0 | 38th | 38th | 50.9 |
– In last Fall’s Las Vegas Cup race the entire Top 6 finishers started inside the Top 10, the first time this happened in a Las Vegas Cup race.
| Rank | Driver | Avg. Fin. | Best | Worst | Starts |
| 1 | Kyle Larson | 9.00 | 1st | 35th | 19 |
| 2 | Joey Logano | 9.60 | 1st | 36th | 25 |
| 3 | Kyle Busch | 11.93 | 1st | 41st | 29 |
| 4 | Jimmie Johnson | 12.30 | 1st | 41st | 23 |
| 5 | Denny Hamlin | 12.36 | 1st | 32nd | 28 |
| 6 | Brad Keselowski | 12.48 | 1st | 38th | 25 |
| 7 | William Byron | 15.00 | 1st | 37th | 16 |
| 8 | Ryan Blaney | 15.16 | 3rd | 38th | 19 |
| 9 | Tyler Reddick | 15.50 | 2nd | 38th | 12 |
| 10 | Christopher Bell | 15.75 | 2nd | 34th | 12 |
| 11 | Alex Bowman | 16.18 | 1st | 43rd | 17 |
| 12 | Ross Chastain | 16.47 | 2nd | 33rd | 15 |
| 13 | Chris Buescher | 17.44 | 9th | 37th | 18 |
| 14 | Daniel Suarez | 17.94 | 2nd | 37th | 17 |
| 15 | Riley Herbst | 18.00 | 17th | 19th | 2 |
| 16 | Austin Dillon | 18.10 | 4th | 37th | 21 |
| 17 | Noah Gragson | 18.17 | 6th | 31st | 6 |
| 18 | Chase Elliott | 18.94 | 2nd | 38th | 17 |
| 19 | Austin Cindric | 19.63 | 6th | 34th | 8 |
| 20 | A.J. Allmendinger | 19.67 | 6th | 37th | 15 |
| 21 | Ricky Stenhouse Jr. | 19.90 | 3rd | 33rd | 21 |
| 22 | Josh Berry | 20.00 | 1st | 29th | 5 |
| 23 | Chase Briscoe | 20.30 | 4th | 35th | 10 |
| 24 | Erik Jones | 20.35 | 8th | 40th | 17 |
| 25 | John Hunter Nemechek | 20.67 | 9th | 29th | 6 |
| 26 | Casey Mears | 21.38 | 7th | 40th | 13 |
| 27 | Ryan Preece | 21.42 | 3rd | 37th | 12 |
| 28 | Bubba Wallace | 22.56 | 4th | 38th | 16 |
| 29 | Ty Gibbs | 24.14 | 5th | 34th | 7 |
| 30 | Cole Custer | 24.56 | 16th | 33rd | 9 |
| 31 | Zane Smith | 24.75 | 16th | 36th | 4 |
| 32 | Ty Dillon | 25.31 | 10th | 37th | 13 |
| 33 | Todd Gilliland | 26.38 | 21st | 31st | 8 |
| 34 | Carson Hocevar | 27.20 | 15th | 36th | 5 |
| 35 | Michael McDowell | 27.67 | 16th | 43rd | 24 |
| 36 | J.J. Yeley | 30.71 | 17th | 43rd | 17 |
| 37 | Cody Ware | 30.89 | 21st | 36th | 9 |
| 38 | Justin Allgaier | 31.00 | 31st | 31st | 2 |
| 39 | B.J. McLeod | 31.33 | 28th | 37th | 9 |
| 40 | Shane Van Gisbergen | 32.00 | 29th | 34th | 3 |
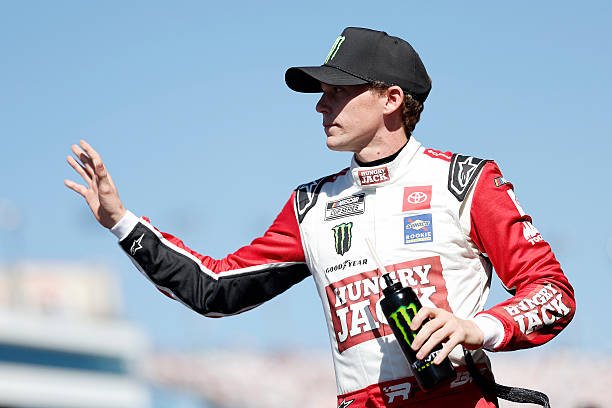
Las Vegas native Riley Herbst must enjoy some home cooking as he is the only active Cup driver to not finish out of the Top 20 in a race here, granted he’s only ran 2 Cup races here. Photo by Logan Riely — Getty Images
| Best Active Las Vegas Avg. Driver Rating |
Best Active Las Vegas Avg. Top 15% |
||||||
| Rank | Driver | Driv. Rate | Starts | Rank | Driver | Top 15% | Starts |
| 1 | Kyle Larson | 107.23 | 19 | 1 | Joey Logano | 81.48 | 25 |
| 2 | Joey Logano | 100.50 | 25 | 2 | Kyle Larson | 77.74 | 19 |
| 3 | Jimmie Johnson | 98.33 | 20 | 3 | William Byron | 75.94 | 16 |
| 4 | William Byron | 97.26 | 16 | 4 | Kyle Busch | 74.71 | 28 |
| 5 | Kyle Busch | 96.66 | 28 | 5 | Chase Elliott | 70.10 | 17 |
| 6 | Denny Hamlin | 91.60 | 28 | 6 | Ryan Blaney | 67.49 | 19 |
| 7 | Ryan Blaney | 90.37 | 19 | 7 | Jimmie Johnson | 67.15 | 20 |
| 8 | Chase Elliott | 88.61 | 17 | 8 | Tyler Reddick | 67.13 | 12 |
| 9 | Tyler Reddick | 88.04 | 12 | 9 | Alex Bowman | 66.26 | 17 |
| 10 | Brad Keselowski | 87.82 | 25 | 10 | Denny Hamlin | 66.04 | 28 |
– Don’t be surprised if Joey Logano and Kyle Larson do well this weekend at Las Vegas as they are top 2 in both tables above.
| Best Active Laps Led% | Best Active Laps Completed% | ||||||
| Rank | Driver | Laps Led% | Starts | Rank | Driver | Laps Comp% | Starts |
| 1 | Kyle Larson | 16.09 | 19 | 1 | Riley Herbst | 100 | 2 |
| 2 | Jimmie Johnson | 9.65 | 23 | 2 | John Hunter Nemechek | 99.88 | 6 |
| 3 | Joey Logano | 8.72 | 25 | 3 | Josh Berry | 99.70 | 5 |
| 4 | William Byron | 7.86 | 16 | 4 | Todd Gilliland | 99.53 | 8 |
| 5 | Christopher Bell | 7.71 | 12 | 5 | Ross Chastain | 99.40 | 15 |
| 6 | Denny Hamlin | 5.60 | 28 | 6 | Jimmie Johnson | 99.35 | 23 |
| 7 | Brad Keselowski | 5.38 | 25 | 7 | Ricky Stenhouse Jr. | 99.29 | 21 |
| 8 | Kyle Busch | 4.27 | 29 | 8 | A.J. Allmendinger | 98.98 | 15 |
| 9 | Ross Chastain | 4.15 | 15 | 9 | Denny Hamlin | 98.87 | 28 |
| 10 | Chase Elliott | 3.91 | 17 | 10 | Zane Smith | 98.78 | 4 |
– Kyle Larson is the only active driver to lead over 10% of the laps in races he’s ran here at Las Vegas.
| Most Active Las Vegas Starts | Most Active Las Vegas Poles | ||||
| Rank | Driver | Starts | Rank | Driver | Poles |
| 1 | Kyle Busch | 29 | T1 | Christopher Bell | 3 |
| 2 | Denny Hamlin | 28 | T1 | Joey Logano | 3 |
| T3 | Brad Keselowski | 25 | 3 | Kyle Busch | 2 |
| T3 | Joey Logano | 25 | T4 | Tyler Reddick | 1 |
| 5 | Michael McDowell | 24 | T4 | Erik Jones | 1 |
| 6 | Jimmie Johnson | 23 | T4 | Ryan Blaney | 1 |
| T7 | Austin Dillon | 21 | T4 | Michael McDowell | 1 |
| T7 | Ricky Stenhouse Jr. | 21 | T4 | Brad Keselowski | 1 |
| T9 | Kyle Larson | 19 | T4 | Denny Hamlin | 1 |
| T9 | Ryan Blaney | 19 | |||
– There are 9 drivers on the Poles list above and on the Wins list below, but there are only 4 drivers that overlap between the 2 tables (Busch, Keselowski, Hamlin, Logano).
| Rank | Driver | Wins | Win% | Rank | Driver | Wins | Win% |
| T1 | Jimmie Johnson | 4 | 17.39 | T6 | Josh Berry | 1 | 20.00 |
| T1 | Joey Logano | 4 | 16.00 | T6 | William Byron | 1 | 6.25 |
| T3 | Kyle Larson | 3 | 15.79 | T6 | Alex Bowman | 1 | 5.88 |
| T3 | Brad Keselowski | 3 | 12.00 | T6 | Kyle Busch | 1 | 3.45 |
| 5 | Denny Hamlin | 2 | 7.14 |
| Most Active Las Vegas Top 3’s | Best Active Las Vegas Top 3% | |||||
| Rank | Driver | Top 3’s | Rank | Driver | Top3% | Top3’s |
| T1 | Kyle Larson | 9 | 1 | Kyle Larson | 47.37 | 9 |
| T1 | Kyle Busch | 9 | 2 | Kyle Busch | 31.03 | 9 |
| 3 | Brad Keselowski | 7 | 3 | Brad Keselowski | 28.00 | 7 |
| 4 | Jimmie Johnson | 6 | 4 | Jimmie Johnson | 26.09 | 6 |
| 5 | Joey Logano | 5 | 5 | Christopher Bell | 25.00 | 3 |
| 6 | Denny Hamlin | 4 | T6 | Joey Logano | 20.00 | 5 |
| 7 | Christopher Bell | 3 | T6 | Josh Berry | 20.00 | 1 |
| T8 | Ross Chastain | 2 | 8 | Denny Hamlin | 14.29 | 4 |
| T8 | Alex Bowman | 2 | 9 | Ross Chastain | 13.33 | 2 |
| T8 | Chase Elliott | 2 | T10 | Alex Bowman | 11.76 | 2 |
| T8 | Daniel Suarez | 2 | T10 | Chase Elliott | 11.76 | 2 |
| T10 | Daniel Suarez | 11.76 | 2 | |||
It shouldn’t come as a shock if Kyle Larson finishes near the front this weekend at Las Vegas as he’s either 1st or 2nd in both Top 3 tables above and both Top 5 tables below. Photo by Logan Riely — Getty Images
| Most Active Las Vegas Top 5’s | Best Active Las Vegas Top 5% | |||||
| Rank | Driver | Top 5’s | Rank | Driver | Top5% | Top5’s |
| 1 | Kyle Busch | 12 | 1 | Kyle Larson | 47.37 | 9 |
| T2 | Kyle Larson | 9 | 2 | Kyle Busch | 41.38 | 12 |
| T2 | Brad Keselowski | 9 | 3 | Brad Keselowski | 36.00 | 9 |
| 4 | Joey Logano | 8 | T4 | Ross Chastain | 33.33 | 5 |
| T5 | Jimmie Johnson | 7 | T4 | Christopher Bell | 33.33 | 4 |
| T5 | Denny Hamlin | 7 | 6 | Joey Logano | 32.00 | 8 |
| 7 | Ryan Blaney | 6 | 7 | Ryan Blaney | 31.58 | 6 |
| 8 | Ross Chastain | 5 | 8 | Jimmie Johnson | 30.43 | 7 |
| T9 | Christopher Bell | 4 | T9 | Denny Hamlin | 25.00 | 7 |
| T9 | William Byron | 4 | T9 | William Byron | 25.00 | 4 |
| T9 | Alex Bowman | 4 | ||||
| Most Active Las Vegas Top 10’s | Best Active Las Vegas Top 10% | |||||
| Rank | Driver | Top 10’s | Rank | Driver | Top 10% | Top 10’s |
| 1 | Kyle Busch | 16 | 1 | Kyle Larson | 73.68 | 14 |
| T2 | Joey Logano | 15 | 2 | Joey Logano | 60.00 | 15 |
| T2 | Denny Hamlin | 15 | 3 | Brad Keselowski | 56.00 | 14 |
| T4 | Kyle Larson | 14 | 4 | Kyle Busch | 55.17 | 16 |
| T4 | Brad Keselowski | 14 | 5 | Denny Hamlin | 53.57 | 15 |
| T6 | Ryan Blaney | 10 | 6 | Ryan Blaney | 52.63 | 10 |
| T6 | Jimmie Johnson | 10 | T7 | William Byron | 50.00 | 8 |
| 8 | William Byron | 8 | T7 | Christopher Bell | 50.00 | 6 |
| 9 | Alex Bowman | 7 | ||||
| T10 | Christopher Bell | 6 | T7 | Tyler Reddick | 50.00 | 6 |
| T10 | Tyler Reddick | 6 | ||||
| T10 | Ross Chastain | 6 | 10 | Jimmie Johnson | 43.48 | 10 |
| T10 | Chase Elliott | 6 | ||||
– If you’re betting who might get a Top 10 this weekend the Top 10% list above is a good place to start as the top 9 drivers in the table are in the race this weekend and have finished half (or more) of their races here inside the Top 10.
| Rank | Driver | Stage Wins | Stage Win% | Rank | Driver | Stage Wins | Stage Win% |
| 1 | Kyle Larson | 8 | 25.00 | T7 | Christopher Bell | 1 | 4.17 |
| T2 | Chase Elliott | 3 | 9.38 | T7 | Tyler Reddick | 1 | 4.17 |
| T2 | William Byron | 3 | 9.38 | T7 | Alex Bowman | 1 | 3.33 |
| T4 | Brad Keselowski | 2 | 5.88 | T7 | Ross Chastain | 1 | 3.33 |
| T4 | Denny Hamlin | 2 | 5.88 | T7 | Bubba Wallace | 1 | 3.13 |
| T4 | Joey Logano | 2 | 5.88 | T7 | Ryan Blaney | 1 | 2.94 |
| T7 | Austin Cindric | 1 | 6.25 |

Kyle Larson has been really good here at Las Vegas as he has the most Stage Wins, best Stage Win%, most Stage T10’s, and best Stage T10% of any active driver. Photo by Chris Williams — LVMS via Icon Sportswire
| Most Active Las Vegas Stage T10’s | Best Active Las Vegas Stage T10% | |||||
| Rank | Driver | Stage T10’s | Rank | Driver | Stage T10% | Stage T10’s |
| 1 | Kyle Larson | 25 | 1 | Kyle Larson | 78.13 | 25 |
| 2 | Joey Logano | 23 | 2 | Joey Logano | 67.65 | 23 |
| T3 | Chase Elliott | 21 | T3 | Chase Elliott | 65.63 | 21 |
| T3 | William Byron | 21 | T3 | William Byron | 65.63 | 21 |
| T5 | Denny Hamlin | 20 | T5 | Denny Hamlin | 58.82 | 20 |
| T5 | Ryan Blaney | 20 | T5 | Ryan Blaney | 58.82 | 20 |
| T7 | Alex Bowman | 17 | 7 | Christopher Bell | 58.33 | 14 |
| T7 | Kyle Busch | 17 | 8 | Alex Bowman | 56.67 | 17 |
| 9 | Brad Keselowski | 15 | 9 | Kyle Busch | 50.00 | 17 |
| 10 | Christopher Bell | 14 | 10 | Tyler Reddick | 45.83 | 11 |
| Most Active Las Vegas Starts without Win | Most Active Las Vegas Starts without Pole | ||||
| Rank | Driver | Starts | Rank | Driver | Starts |
| 1 | Michael McDowell | 24 | 1 | Jimmie Johnson | 23 |
| T2 | Austin Dillon | 21 | T2 | Austin Dillon | 21 |
| T2 | Ricky Stenhouse Jr. | 21 | T2 | Ricky Stenhouse Jr. | 21 |
| 4 | Ryan Blaney | 19 | 4 | Kyle Larson | 19 |
| 5 | Chris Buescher | 18 | 5 | Chris Buescher | 18 |
| T6 | Chase Elliott | 17 | T6 | Alex Bowman | 17 |
| T6 | Daniel Suarez | 17 | T6 | Chase Elliott | 17 |
| T6 | Erik Jones | 17 | T6 | Daniel Suarez | 17 |
| T6 | J.J. Yeley | 17 | T6 | J.J. Yeley | 17 |
| 10 | Bubba Wallace | 16 | T10 | Bubba Wallace | 16 |
| T10 | William Byron | 16 | |||
– Jimmie Johnson and Kyle Larson have won a combined 7 races here at Las Vegas, but in their 42 starts they have yet to pull off winning a Pole here.
| Most Active Las Vegas Starts without Top 3 | Most Active Las Vegas Starts without Top 5 | ||||
| Rank | Driver | Starts | Rank | Driver | Starts |
| 1 | Michael McDowell | 24 | 1 | Michael McDowell | 24 |
| 2 | Austin Dillon | 21 | 2 | Chris Buescher | 18 |
| 3 | Chris Buescher | 18 | T3 | Erik Jones | 17 |
| T4 | Erik Jones | 17 | T3 | J.J. Yeley | 17 |
| T4 | J.J. Yeley | 17 | 5 | A.J. Allmendinger | 15 |
– The only thing that changed about the tables above after last Fall’s Las Vegas race is that Corey LaJoie is not an active driver yet this year.
| Rank | Driver | Starts |
| 1 | Michael McDowell | 24 |
| 2 | J.J. Yeley | 17 |
| T3 | B.J. McLeod | 9 |
| T3 | Cody Ware | 9 |
| T3 | Cole Custer | 9 |

This image sums up Michael McDowell’s (#34) career at Las Vegas as he is 1st or tied for 1st in 6 of the 7 “without” tables above and below. Photo by Chris Graythen — Getty Images
| Most Active Las Vegas Stages without Stage Win | Most Active Las Vegas Stages without Stage T10 | ||||
| Rank | Driver | Stages | Rank | Driver | Stages |
| T1 | Austin Dillon | 34 | 1 | Michael McDowell | 34 |
| T1 | Chris Buescher | 34 | 2 | Ty Dillon | 26 |
| T1 | Daniel Suarez | 34 | 3 | J.J. Yeley | 20 |
| T1 | Erik Jones | 34 | T4 | B.J. McLeod | 18 |
| T1 | Kyle Busch | 34 | T4 | Cody Ware | 18 |
| T1 | Michael McDowell | 34 | T4 | Cole Custer | 18 |
| T1 | Ricky Stenhouse Jr. | 34 | 7 | Todd Gilliland | 16 |
| 8 | Ty Dillon | 26 | T8 | John Hunter Nemechek | 12 |
| 9 | Ryan Preece | 24 | T8 | Noah Gragson | 12 |
| T10 | Chase Briscoe | 20 | 10 | Zane Smith | 8 |
| T10 | J.J. Yeley | 20 | |||
| Driver | Streak | Category | Driver | Streak | Category |
| Alex Bowman | 3 | Top 10’s | Chase Briscoe | 2 | Stage T10’s |
| Kyle Larson | 2 | Top 10’s | Christopher Bell | 2 | Stage T10’s |
| Ryan Preece | 2 | Top 10’s | Denny Hamlin | 2 | Stage T10’s |
| Kyle Larson | 4 | Stage T10’s | Joey Logano | 2 | Stage T10’s |
| Tyler Reddick | 3 | Stage T10’s | Ty Gibbs | 2 | Stage T10’s |
| William Byron | 3 | Stage T10’s |
| Rank | Race | Laps Led% | Driver | Fin. | Rank | Race | Laps Led% | Driver | Fin. |
| 1 | 2024-03 | 67.79 | Kyle Larson | 1st | 6 | 2022-03 | 30.29 | Ross Chastain | 3rd |
| 2 | 2023-03 | 64.94 | William Byron | 1st | 7 | 2022-33 | 25.47 | Ross Chastain | 2nd |
| 3 | 2024-33 | 58.05 | Christopher Bell | 2nd | 8 | 2023-03 | 23.25 | Kyle Larson | 2nd |
| 4 | 2023-33 | 49.81 | Kyle Larson | 1st | T9 | 2023-33 | 22.85 | Christopher Bell | 2nd |
| 5 | 2025-33 | 48.31 | Kyle Larson | 2nd | T9 | 2025-05 | 22.85 | Kyle Larson | 9th |
– Don’t be surprised if Christopher Bell, Kyle Larson, and Ross Chastain lead a lot this weekend as those 3 drivers make up 9 of the 10 spots in the Laps Led% table above and 7 of the 10 spots in the Driver Rating table below.
| Rank | Race | Driver |
Driv. Rate |
Fin. | Rank | Race | Driver |
Driv. Rate |
Fin. |
| 1 | 2023-03 | William Byron | 148.2 | 1st | 6 | 2022-33 | Joey Logano | 130.6 | 1st |
| 2 | 2024-03 | Kyle Larson | 148.1 | 1st | 7 | 2022-03 | Ross Chastain | 128.3 | 3rd |
| 3 | 2023-33 | Kyle Larson | 146.5 | 1st | 8 | 2023-03 | Kyle Larson | 126.3 | 2nd |
| T4 | 2024-33 | Christopher Bell | 138.4 | 2nd | 9 | 2023-33 | Christopher Bell | 126.0 | 2nd |
| T4 | 2025-33 | Kyle Larson | 138.4 | 2nd | 10 | 2025-05 | Josh Berry | 124.2 | 1st |
| Rank | Race | Driver |
Top 15% | Fin. | Rank | Race | Driver |
Top 15% | Fin. |
| T1 | 2022-03 | Ross Chastain | 100 | 3rd | T7 | 2024-33 | Christopher Bell | 100 | 2nd |
| T1 | 2022-03 | Chase Elliott | 100 | 9th | T7 | 2022-33 | Joey Logano | 99.63 | 1st |
| T1 | 2023-03 | William Byron | 100 | 1st | T7 | 2023-03 | Bubba Wallace | 99.63 | 4th |
| T1 | 2023-33 | Christopher Bell | 100 | 2nd | T7 | 2023-03 | Ross Chastain | 99.63 | 12th |
| T1 | 2023-33 | William Byron | 100 | 7th | T7 | 2023-33 | Kyle Larson | 99.63 | 1st |
| T1 | 2024-03 | Kyle Larson | 100 | 1st | T7 | 2024-03 | Martin Truex Jr. | 99.63 | 7th |
– In both races at Las Vegas in 2025 no driver ran 99.63% (or more) of the race laps in the Top 15, and thus no driver from the 2 races are mentioned in the table above.
| Best Next Gen Avg. Fin. by Starting Position (1-37) |
Worst Next Gen Avg. Fin. by Starting Position (1-37) |
||||
| Rank | Start Pos. | Avg. Fin | Rank | Start Pos. | Avg. Fin |
| 1 | 12th | 10.13 | 1 | 38th | 31.00 |
| 2 | 1st | 10.25 | 2 | 35th | 28.13 |
| T3 | 2nd | 11.00 | 3 | 36th | 27.63 |
| T3 | 6th | 11.00 | 4 | 26th | 25.63 |
| 5 | 3rd | 11.88 | 5 | 29th | 25.50 |
| 6 | 18th | 12.88 | 6 | 17th | 25.38 |
| T7 | 7th | 13.50 | 7 | 37th | 25.00 |
| T7 | 10th | 13.50 | 8 | 32nd | 24.63 |
| 9 | 16th | 14.38 | 9 | 33rd | 23.88 |
| 10 | 8th | 15.25 | 10 | 25th | 23.75 |
– Based on the 8 Next Gen races run at Las Vegas it seems that starting Top 10 is a good indication of success generally, whereas typically starting 25th or worse leads to not so good success here.
| Best Next Gen Las Vegas Avg. Driver Rating |
Best Next Gen Las Vegas Avg. Top 15% |
||||||
| Rank | Driver | Driv. Rate | Starts | Rank | Driver | Top 15% | Starts |
| 1 | Kyle Larson | 117.01 | 8 | 1 | William Byron | 90.41 | 8 |
| 2 | William Byron | 110.31 | 8 | 2 | Martin Truex Jr. | 88.03 | 6 |
| 3 | Martin Truex Jr. | 101.23 | 6 | 3 | Joey Logano | 87.33 | 8 |
| 4 | Ross Chastain | 98.79 | 8 | 4 | Kevin Harvick | 85.91 | 4 |
| 5 | Alex Bowman | 97.63 | 7 | 5 | Kyle Larson | 83.19 | 8 |
| 6 | Tyler Reddick | 97.40 | 8 | 6 | Tyler Reddick | 80.07 | 8 |
| 7 | Denny Hamlin | 97.23 | 8 | 7 | Denny Hamlin | 77.97 | 8 |
| 8 | Joey Logano | 96.21 | 8 | 8 | Alex Bowman | 74.73 | 7 |
| 9 | Christopher Bell | 96.13 | 8 | 9 | Christopher Bell | 72.57 | 8 |
| 10 | Kyle Busch | 85.45 | 8 | 10 | Ross Chastain | 71.91 | 8 |
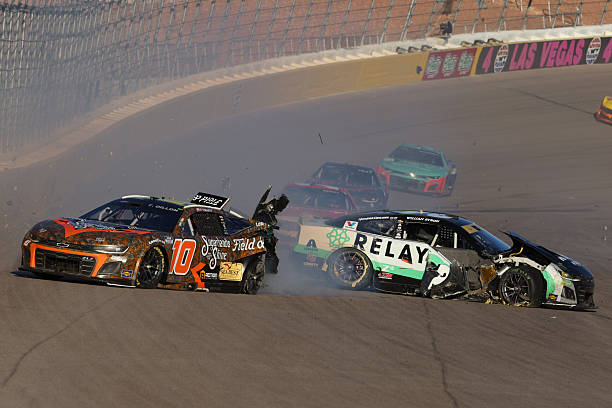
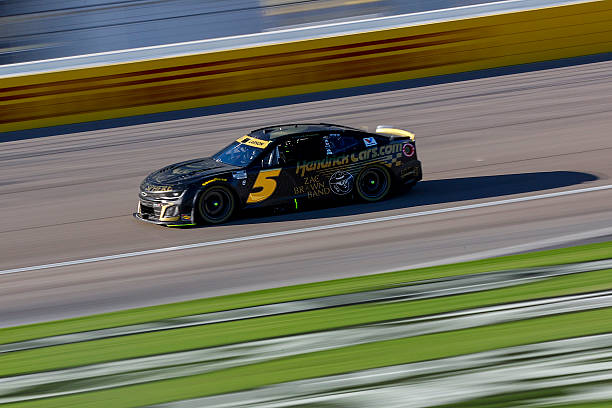
Despite this bizarre crash causing him to miss the last 32 laps of last Fall’s Las Vegas Cup race, William Byron has still run 90% of the Next Gen laps here in the Top 15. Photo by Marc Sanchez — LVMS — Icon Sportswire via Getty Images
| Best Next Gen Las Vegas Avg. Finish | Best Next Gen Las Vegas Laps Led% | ||||||
| Rank | Driver | Avg. Fin. | Starts | Rank | Driver | Laps Led% | Starts |
| 1 | Martin Truex Jr. | 7.33 | 6 | 1 | Kyle Larson | 27.71 | 8 |
| 2 | Ross Chastain | 7.63 | 8 | 2 | William Byron | 12.39 | 8 |
| 3 | Kyle Larson | 7.88 | 8 | 3 | Christopher Bell | 11.55 | 8 |
| 4 | William Byron | 10.00 | 8 | 4 | Ross Chastain | 7.78 | 8 |
| 5 | Alex Bowman | 10.86 | 7 | 5 | Daniel Suarez | 5.36 | 8 |
| 6 | Joey Logano | 11.75 | 8 | 6 | Denny Hamlin | 4.56 | 8 |
| 7 | Kevin Harvick | 12.25 | 4 | 7 | Joey Logano | 4.19 | 8 |
| 8 | Denny Hamlin | 12.50 | 8 | 8 | Tyler Reddick | 3.73 | 8 |
| 9 | Christopher Bell | 12.63 | 8 | 9 | Kyle Busch | 3.26 | 8 |
| 10 | Tyler Reddick | 12.75 | 8 | 10 | Chase Briscoe | 2.98 | 8 |
– If you want to see who might lead laps and finish up front in the race this weekend look at the two tables above as there are 7 drivers that are on both tables.
| Next Gen Las Vegas Win List | Next Gen Las Vegas Pole List | |||||
| Rank | Driver | Wins | Win% | Rank | Driver | Poles |
| T1 | Joey Logano | 2 | 25.00 | 1 | Christopher Bell | 3 |
| T1 | Kyle Larson | 2 | 25.00 | 2 | Joey Logano | 2 |
| T3 | Josh Berry | 1 | 20.00 | T3 | Denny Hamlin | 1 |
| T3 | Alex Bowman | 1 | 14.29 | T3 | Michael McDowell | 1 |
| T3 | Denny Hamlin | 1 | 12.50 | T3 | Tyler Reddick | 1 |
| T3 | William Byron | 1 | 12.50 | |||
– Lookout for Toyota to be fast in qualifying this weekend as they’ve won 5 of the 8 Next Gen Poles here at Las Vegas.
| Rank | Driver | Top 3’s | Top 3% |
| 1 | Kyle Larson | 5 | 62.50 |
| 2 | Christopher Bell | 3 | 37.50 |
| T3 | Alex Bowman | 2 | 28.57 |
| T3 | Daniel Suarez | 2 | 25.00 |
| T3 | Joey Logano | 2 | 25.00 |
| T3 | Kyle Busch | 2 | 25.00 |
| T3 | Ross Chastain | 2 | 25.00 |
| T8 | Josh Berry | 1 | 20.00 |
| T8 | Ryan Preece | 1 | 16.67 |
| T8 | Denny Hamlin | 1 | 12.50 |
| T8 | Ryan Blaney | 1 | 12.50 |
| T8 | Tyler Reddick | 1 | 12.50 |
| T8 | William Byron | 1 | 12.50 |

Kyle Larson has been really good at Las Vegas since the introduction of the Next Gen as he has nearly twice as many Top 3 finishes as an other driver. Photo by Gary Nastase — LVMS — Icon Sportswire via Getty Images
| Most Next Gen Las Vegas Top 5’s | Most Next Gen Las Vegas Top 10’s | ||||||
| Rank | Driver | Top 5’s | Top 5% | Rank | Driver | Top 10’s | Top 10% |
| T1 | Kyle Larson | 5 | 62.50 | T1 | Martin Truex Jr. | 6 | 100 |
| T1 | Ross Chastain | 5 | 62.50 | T1 | Kyle Larson | 6 | 75.00 |
| T3 | Christopher Bell | 4 | 50.00 | T1 | Ross Chastain | 6 | 75.00 |
| T3 | William Byron | 4 | 50.00 | T1 | William Byron | 6 | 75.00 |
| T5 | Alex Bowman | 3 | 42.86 | T5 | Alex Bowman | 5 | 71.43 |
| T5 | Kyle Busch | 3 | 37.50 | T5 | Christopher Bell | 5 | 62.50 |
| T7 | Chase Briscoe | 2 | 25.00 | T5 | Denny Hamlin | 5 | 62.50 |
| T7 | Daniel Suarez | 2 | 25.00 | T5 | Tyler Reddick | 5 | 62.50 |
| T7 | Denny Hamlin | 2 | 25.00 | T9 | Joey Logano | 4 | 50.00 |
| T7 | Joey Logano | 2 | 25.00 | T9 | Kyle Busch | 4 | 50.00 |
| T7 | Tyler Reddick | 2 | 25.00 | ||||
– It’s no secret that Kyle Busch hasn’t been off to a great start this year, but Las Vegas could be just what he needs to turn it around as he’s in both tables above.
| Most Next Gen Las Vegas Stage Wins | Most Next Gen Las Vegas Stage T10’s | ||||||
| Rank | Driver | Stage Wins | Stage Win% | Rank | Driver | Stage T10’s | Stage T10% |
| 1 | Kyle Larson | 6 | 37.50 | 1 | Kyle Larson | 14 | 87.50 |
| 2 | William Byron | 3 | 18.75 | 2 | William Byron | 13 | 81.25 |
| T3 | Alex Bowman | 1 | 7.14 | 3 | Christopher Bell | 12 | 75.00 |
| T3 | Austin Cindric | 1 | 6.25 | 4 | Denny Hamlin | 11 | 68.75 |
| T3 | Bubba Wallace | 1 | 6.25 | 5 | Martin Truex Jr. | 10 | 83.33 |
| T3 | Christopher Bell | 1 | 6.25 | T6 | Bubba Wallace | 9 | 56.25 |
| T3 | Ross Chastain | 1 | 6.25 | T6 | Joey Logano | 9 | 56.25 |
| T6 | Tyler Reddick | 9 | 56.25 | ||||
| T3 | Ryan Blaney | 1 | 6.25 | 9 | Ross Chastain | 8 | 50.00 |
| T10 | Alex Bowman | 7 | 50.00 | ||||
| T3 | Tyler Reddick | 1 | 6.25 | T10 | Kyle Busch | 7 | 43.75 |
| T10 | Ryan Blaney | 7 | 43.75 | ||||
– Look for Kyle Larson and William Byron to get a lot of points early in the race this weekend as they rank top 2 in both Stage Wins and Stage T10’s above.